
FIGURE 4.
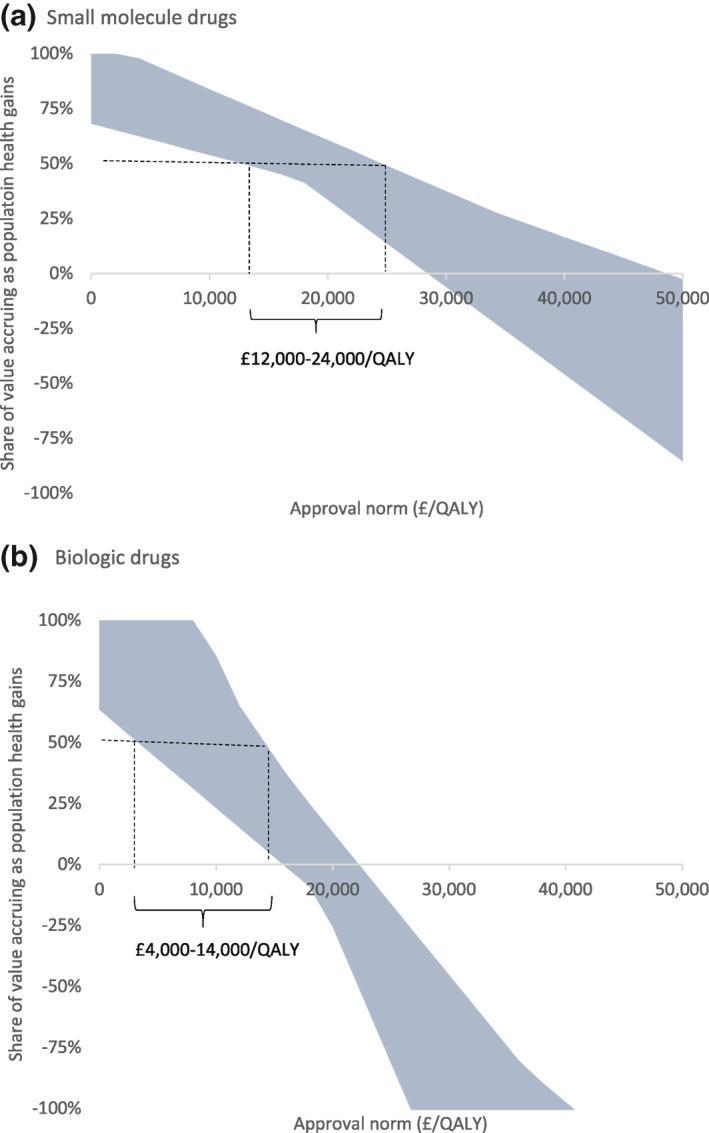
Range of shares of value across (a) small molecule and (b) biologic drugs for different approval norms. The shaded area shows the range of shares of value across the 12 products at different approval norms. The dashed lines indicate the range of approval norms required to deliver a 50% share of value for drugs within each category