
FIGURE 2.
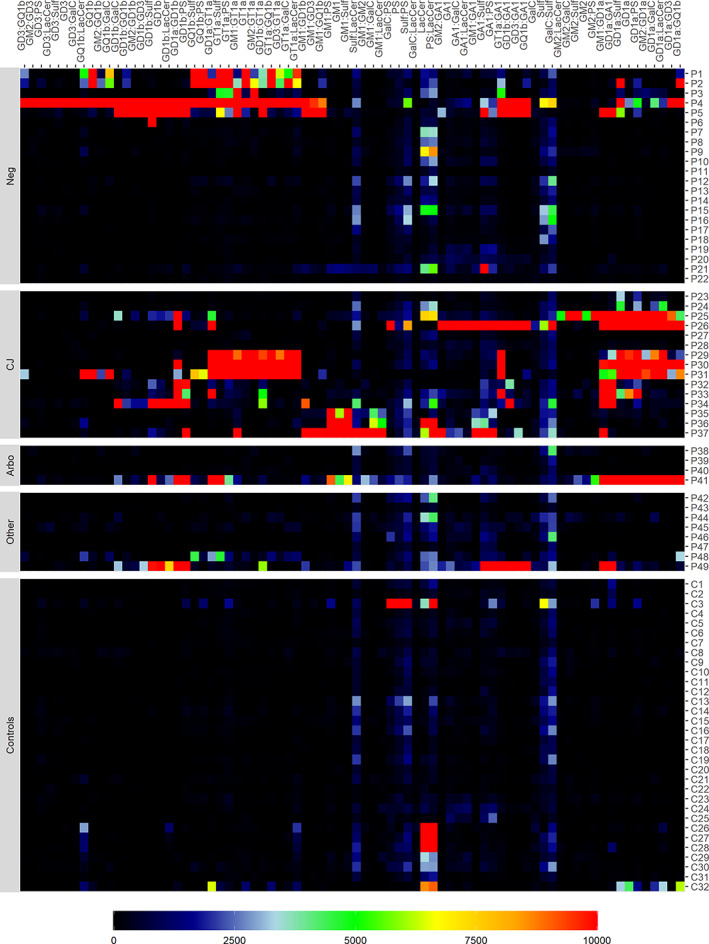
Heatmap of IgG antibody binding to glycolipids as assessed by glycoarray. Each row presents one patient (P1‐P49) or control (C1‐C23); each column presents one of the tested glycolipid antibodies (single or in complex). Raw data were was clustered based on a distance matrix using Pearson's correlation and hierarchical cluster algorithm, and clipped at a 10 000 upper limit