FIGURE 2.

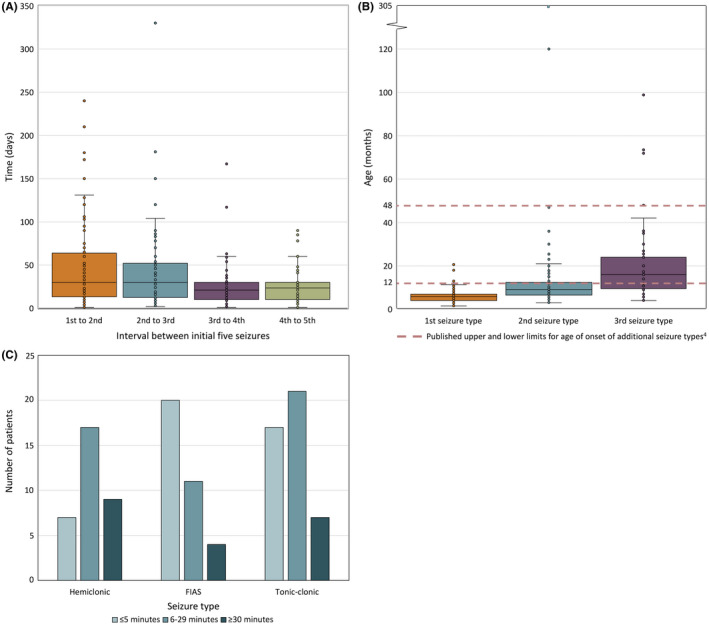
(A) Days between each of the first five seizures. Boxplots show individual data points (dots), median (solid line), interquartile range (boxes), and 1.5× the interquartile range (whiskers). (B) Age at onset of the first three seizure types. Boxplots show individual data points (dots), median (solid line), interquartile range (boxes), and 1.5× the interquartile range (whiskers). Dashed lines denote published upper and lower limits for age of onset of additional seizure types. 4 (C) Average duration of initial hemiclonic, focal impaired awareness seizures, and tonic‐clonic seizures in 33, 35, and 45 patients with available data, respectively
