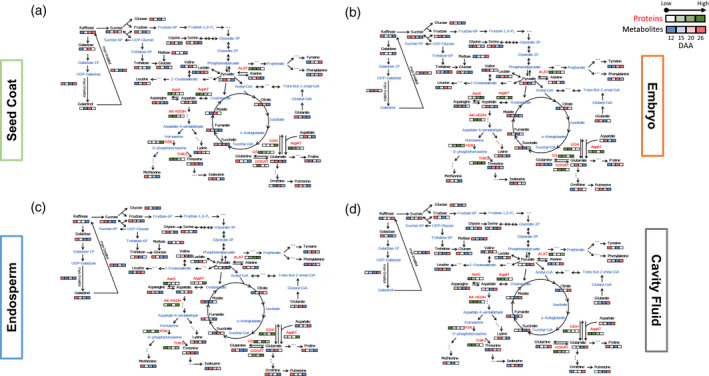
Figure 6.

Integration of metabolite and protein dynamics in a biochemical pathway map. (a) Seed coat. (b) Embryo. (c) Endosperm. (d) Cavity fluid. Metabolites are written in black letters; enzymes are written in red letters. Levels of metabolites and proteins were averaged over three biological replicates after normalization. Four consecutive squares from left to right indicates four developmental stages (12, 15, 20, and 26 days after anthesis). Values of metabolite levels from minimal to maximal are colored from blue to red and protein concentrations are colored from white to green. Metabolites identified by GC‐MS are written in black; metabolites not identified by GC‐MS are written in blue. ALAT, alanine aminotransferase; AK‐HSDH, bifunctional aspartokinase/homoserine dehydrogenase I; AsnS, asparagine synthetase; AspAT, aspartate aminotransferase; GDH, glutamate dehydrogenase; GOGAT, glutamate synthase; GS, glutamine synthetase; HSK, homoserine kinase; THRS, threonine synthase.
