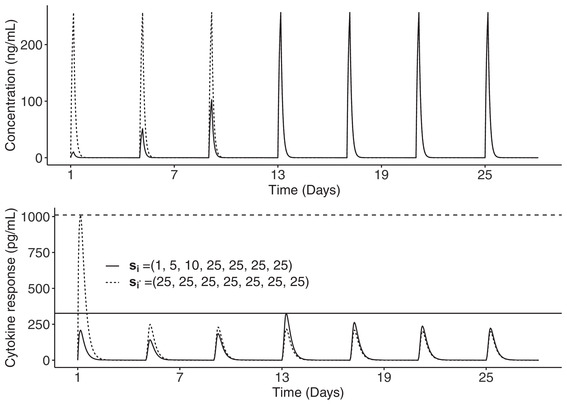
FIGURE 2.

Concentration (up) and cytokine (down) profiles of two patients, one receiving a dose regimen with intrapatient escalation in solid line and the other receiving a dose regimen without intrapatient escalation in dashed line, administered on days 1, 5, 9, 13, 17, 21, and 25. Horizontal lines represent the maximum peak of cytokine observed after each dose regimen
