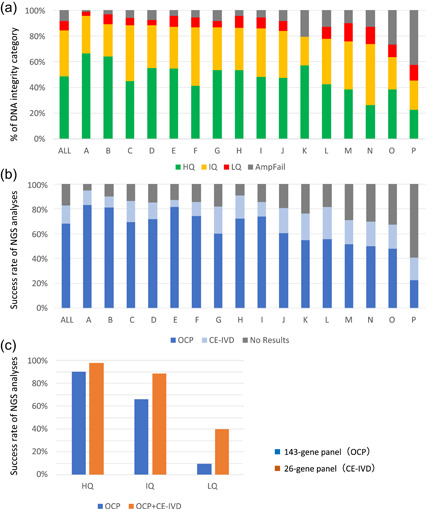
Figure 1.

Inter‐institutional differences in the results of genomic testing using formalin‐fixed paraffin‐embedded (FFPE) samples prepared in routine practice. In total, 2573 gastrointestinal cancer FFPE samples (biopsy and surgical specimens) prepared during routine practice were submitted by 19 institutions participating in the SCRUM‐Japan/GI‐SCREEN nationwide, large‐scale genome screening research project. Among them, data were analyzed for 16 institutions that submitted ≥40 samples for genomic testing. The FFPE samples were sent to a Thermo Fisher Scientific Clinical Laboratory Improvement Amendments‐certified laboratory, where they were subjected to quality control (QC) assay and next‐generation sequencing according to the laboratory's standard operating procedures. Manual microdissection was performed when required, and the ΔC t values were determined after DNA and RNA extraction. Targeted sequencing (Oncomine Cancer Research Panel; OCP, 143 genes and Oncomine Solid Tumour DNA/Fusion Transcript Kit; CE‐IVD, 26 genes) using the Ion PGM™ System (Thermo Fisher Scientific) was performed on the samples that passed the QC. (a) The samples were classified into three categories based on the ΔC t values (high [HQ], intermediate [IQ], and low quality [LQ]); those for which ΔC t values could not be obtained owing to very LQ were classified as PCR‐failures (AmpFail). Overall (indicated as “All”), 48.7%, 35.4%, and 15.9% of the samples from the 19 institutes were classified as high, intermediate, and LQ/PCR‐failure samples for DNA integrity, respectively. There were marked differences in quality among the samples from the 16 institutions that submitted ≥40 samples. (b) Samples (HQ, IQ, and LQ) for which ΔC t values were obtained were analyzed using a comprehensive gene panel (143‐gene panel) and a small panel (26‐gene panel). The success rates of these analyses highly correlated with the result from the QC assay shown in (a). The institutions with high proportions of LQ samples and PCR‐failures also exhibited high failure rates for both panels, and marked differences in quality were observed among the samples from these 16 institutions. Overall (“All” in b), the success rate was 68.1% for the comprehensive gene panel and 14.7% for the small panel, while the failure rate for both panels was 17.2%. (c) The sequencing success rates for the three quality categories are shown, with the HQ samples exhibiting success rates of 90.2% for the 143‐gene panel and 97.4% for the 26‐gene panel
