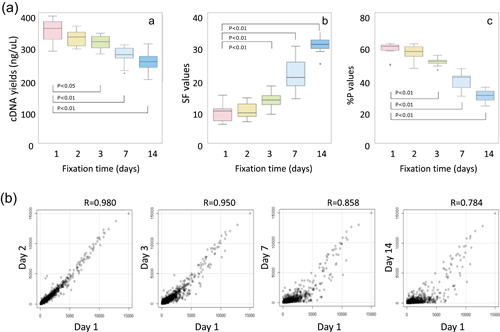
Figure 6.

Effects of prolonged formalin fixation on microarray testing. The effects of fixation time (1, 2, 3, 7, and 14 days) on microarray analysis (GeneChip Human Genome U133 + 2.0 arrays; Affymetrix) performed for breast cancer‐recurrence risk prediction testing were examined using breast cancer samples from 11 cases. The cDNA was synthesized using 100 ng RNA extracted from each sample. After the yield was determined, the microarray testing was performed, and the fluorescence intensity was measured. (a) Examining the cDNA yield after the reverse transcription reaction and two quality control (QC) parameters for microarray testing (SF and % p values) revealed a significant change after 3‐day fixation (*p < 0.05; **p < 0.01) [A–C]. The SF value reflects the mean fluorescence intensity corresponding to the expression level obtained from all probes. It is expressed as a coefficient and used to normalize the mean fluorescence intensity to a specific level. A high value indicates the array is dark due to inappropriate measurement resulting from sample quality or procedural complications. The % p values indicate the proportion of expressed probes compared to all probes. A value below a certain proportion indicates that the measurement is likely to be inappropriate, and that the microarray data are less reliable. (b) Using 1‐day fixation as the control, a correlation analysis was performed to examine the effects of formalin fixation time on the overall expression level of the microarray probes. The results indicated that the correlation coefficients decreased with increased fixation time. In particular, the correlation coefficients for gene probes with a low expression level decreased significantly
