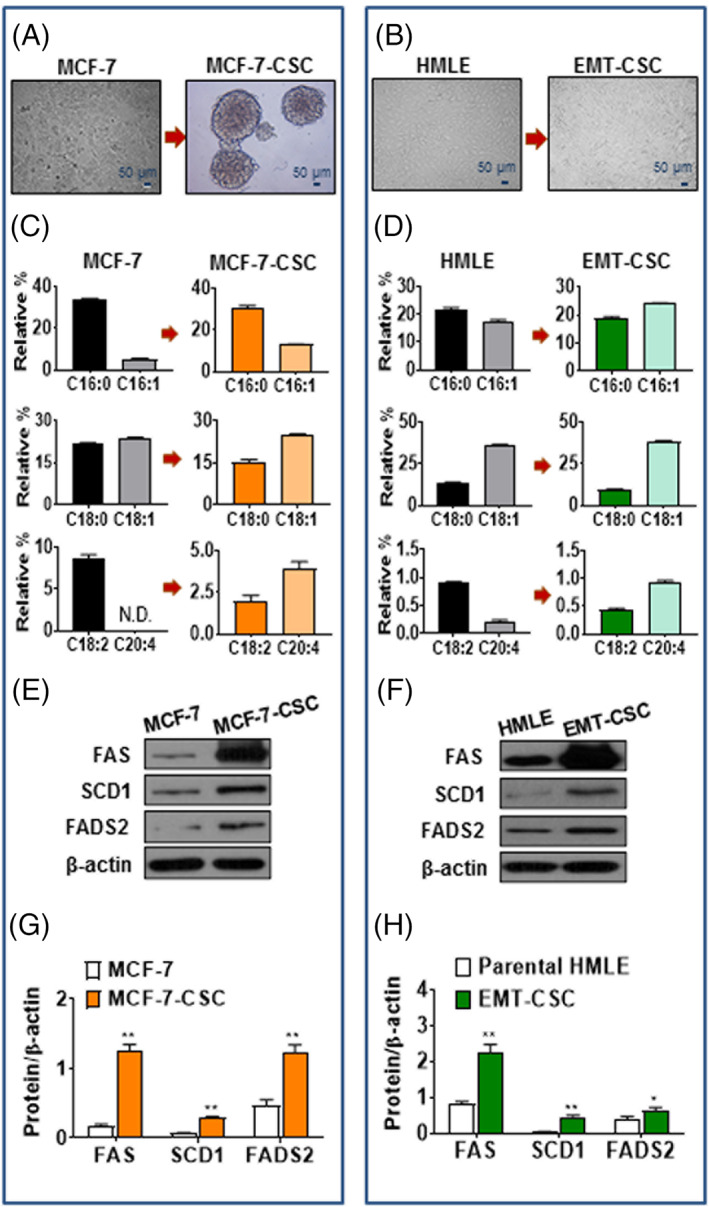
FIGURE 1.

Characteristics of lipid metabolism in breast cancer stem cells. A,B, Representative images of mammosphere cells (MCF‐7‐CSC) derived from MCF‐7 cell line (A) and EMT‐CSC induced from HMLE‐Twist‐ER cells (B). C,D, Comparison of the profiles of SFA and MUFA (top and middle), and of C18:2n‐6 and C20:4n‐6 PUFA (bottom) in MCF‐7‐CSC (C) and EMT‐CSC (D) compared with their parental cells, respectively. E,F, Representative Western blot for protein expressions of FAS, SCD1, and FADS2 in MCF‐7‐CSC (E) and EMT‐CSC (F) compared with their parental cells, respectively. G,H, Relative densiometric bar graphs of FAS, SCD1, and FADS2 in MCF‐7‐CSC (G) and EMT‐CSC (H) compared with their parental cells, respectively. *P < .05; **P < .01 vs parental cells. All the experiments were repeated at least three times. CSC, cancer stem cells; EMT, epithelial‐mesenchymal transition; MUFA, monounsaturated fatty acids; PUFA, polyunsaturated fatty acids; SFA, saturated fatty acids
