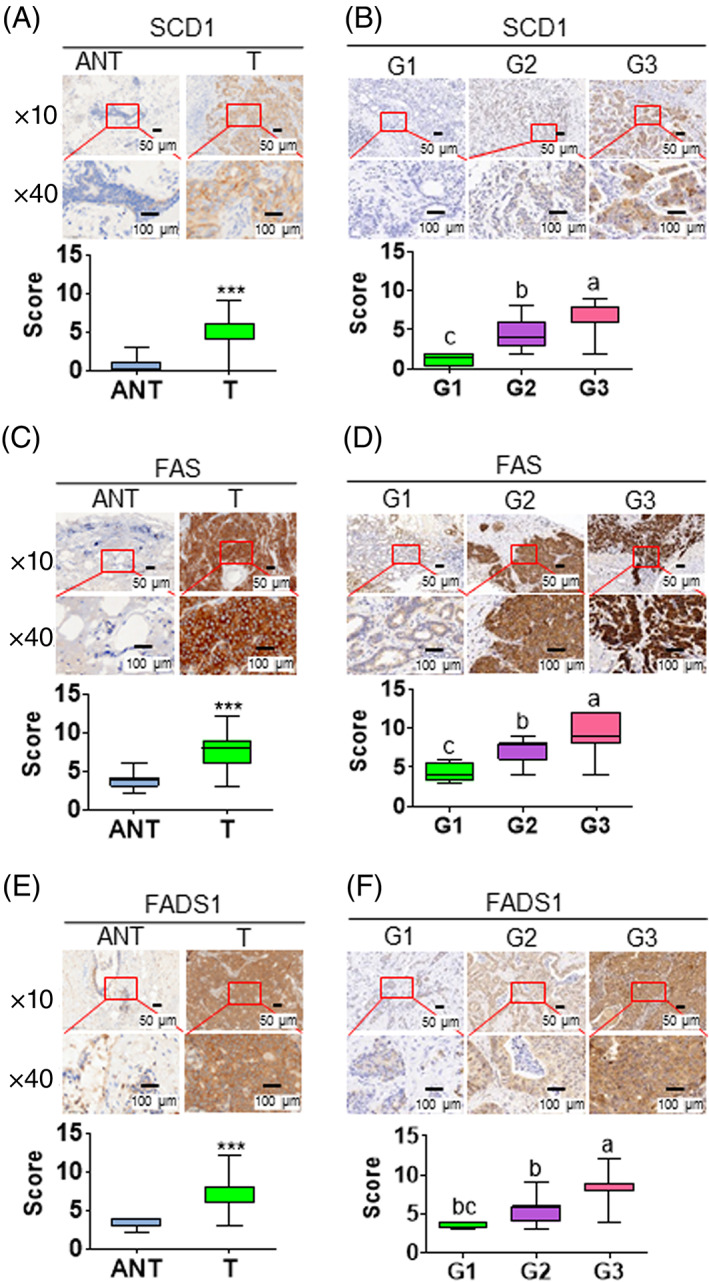
FIGURE 3.

Increased expression of the lipogenic enzymes in human breast cancer tissues. A,C,E, Representative image of IHC analysis for SCD1 (A), FAS (C), and FADS1 (E) expressions in normal and tumor tissues. ANT, tumor‐adjacent normal tissue; T, tumor. B,D,F, Representative image of immunohistochemistry (IHC) analysis for SCD1 (B), FAS (D), and FADS1 (F) expressions between various clinical and tumor grades (G1‐3). ***P < .001 vs vehicle‐treated control cells. Alphabet letters were used to show the significant difference between groups. Each subfigure contains representative image (top) and quantitative results (bottom). The quantitative results were plotted by the values of minimum to maximum
