FIGURE 3.

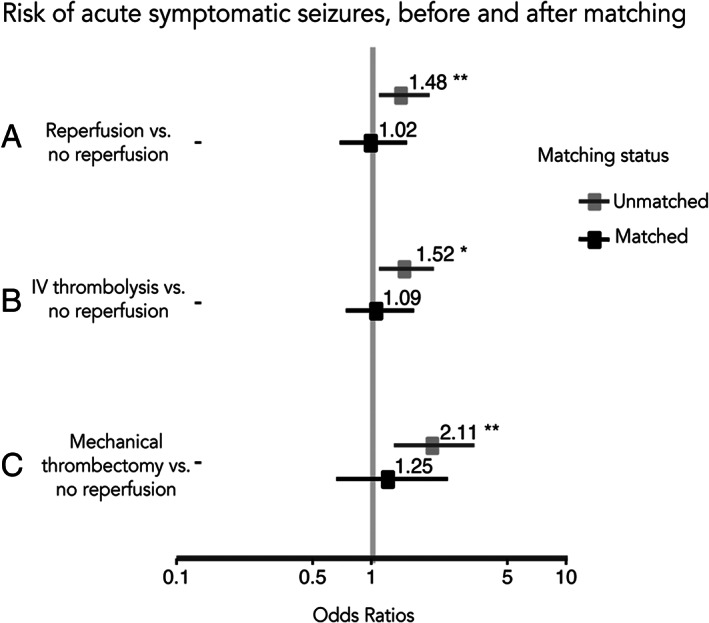
Risk of acute symptomatic seizures, before and after matching. Forest plot showing odd ratios and 95% confidence intervals (horizontal lines) for the risk of acute symptomatic seizures after acute ischemic stroke for each of the scenarios.

Risk of acute symptomatic seizures, before and after matching. Forest plot showing odd ratios and 95% confidence intervals (horizontal lines) for the risk of acute symptomatic seizures after acute ischemic stroke for each of the scenarios.