FIGURE 4.

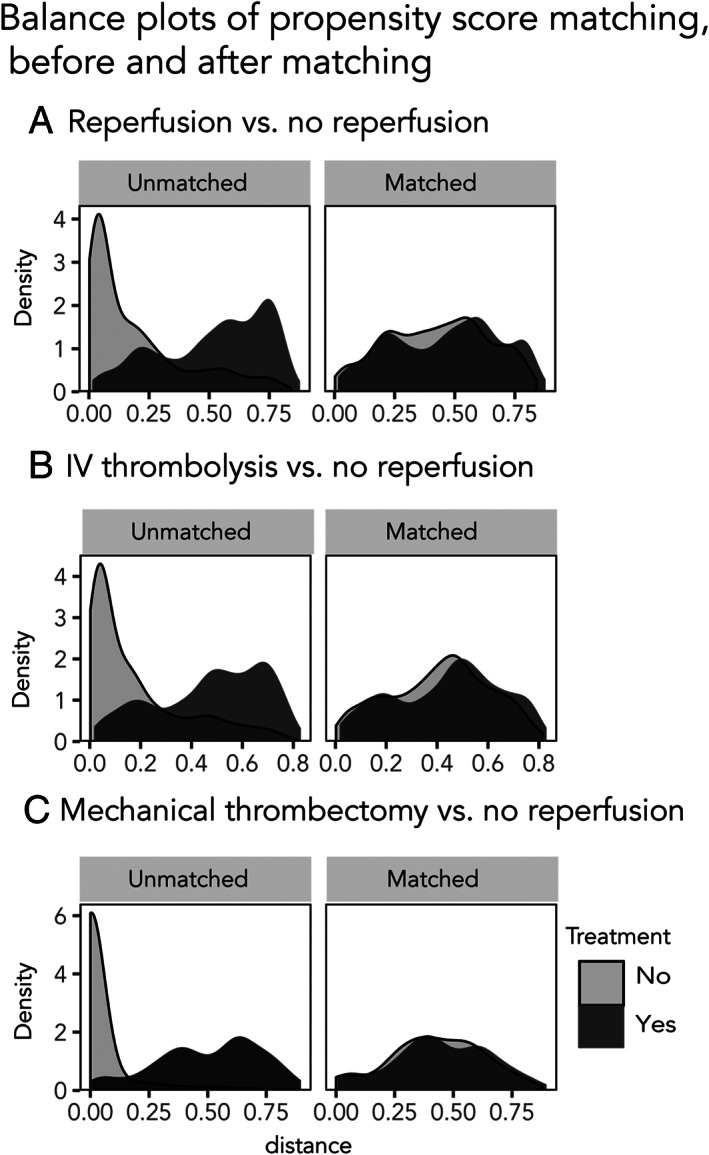
Density plots of propensity score matching. Density plots showing the covariate balance before and after matching, for each of the scenarios.

Density plots of propensity score matching. Density plots showing the covariate balance before and after matching, for each of the scenarios.