
FIGURE 3.
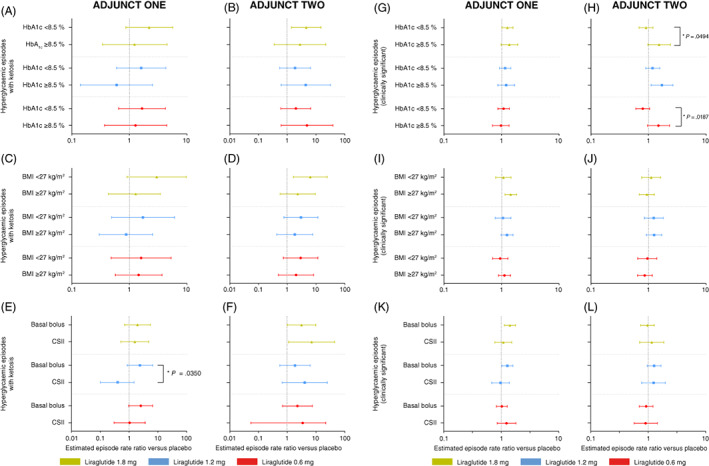
Hyperglycaemia with ketosis and hypoglycaemia (clinically significant): week 26. Data are estimated mean rate ratios versus placebo with 95% confidence intervals at week 26 in ADJUNCT ONE (left panels) and in ADJUNCT TWO (right panels). Estimates are shown for hyperglycaemic episodes with ketosis (episodes with plasma glucose >16.7 mmol/L and plasma ketone >1.5 mmol/L) (panels A‐F), and clinically significant hypoglycaemic episodes (symptomatic hypoglycaemic episodes as defined by Novo Nordisk as severe according to the American Diabetes Association and a plasma glucose value <3.1 mmol/L [<56 mg/dL] with symptoms consistent with hypoglycaemia 20 ) (panels G‐L), by subgroups, by baseline HbA1c level (< or ≥8.5% [69 mmol/mol]), by baseline BMI (< or ≥27 kg/m2), and by type of insulin treatment used at baseline (basal bolus or CSII). Episodes are treatment‐emergent (onset on or after the first day on treatment and no later than the day after the last day on treatment). Estimates were derived from a negative binomial regression model with a log‐link and with treatment, subgroup, country, stratification factor, and the interaction between treatment and subgroup as factors, baseline HbA1c as a covariate, and the logarithm of the exposure time as offset. Unless indicated (*), the episode rate ratio did not differ statistically significantly within subgroups for all liraglutide dose levels. *Indicates a statistically significant test for interaction between treatment and group. BMI, body mass index; CSII, continuous subcutaneous insulin infusion