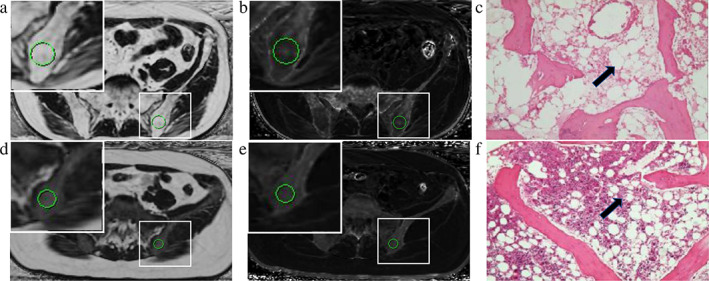
FIGURE 1.

ROIs were manually drawn at the level containing the largest section of the left posterior superior ilium (A, B, D, E). The zoomed version of the ROIs showed in the upper left corner. (A, D) FF value of AA and MDS is 86.98% and 25.84%, respectively. (B, E) Iron content from R2*image is 117.91 and 147.98/second. (C, F) Histologic sections images of AA and MDS. Compared with MDS group (F), the number of fat cells (black arrow) in the AA group (C) was increased.
