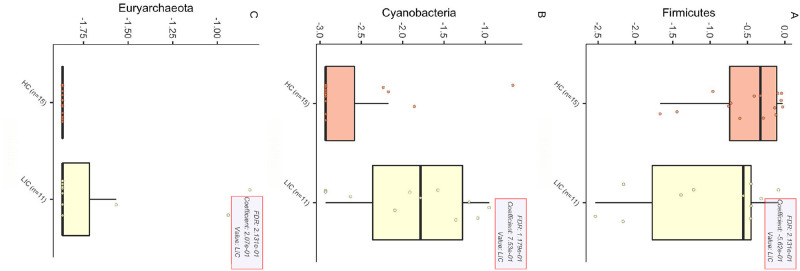
Fig 1. Statistically significant phyla that differed in the LPP swab.
The three panels report all the statistically different phyla found by applying the regression linear model implemented in MaAsLin2 software. Metadata group information were defined considering the healthy/pathologic status (HC = healthy, LIC = lichen).

