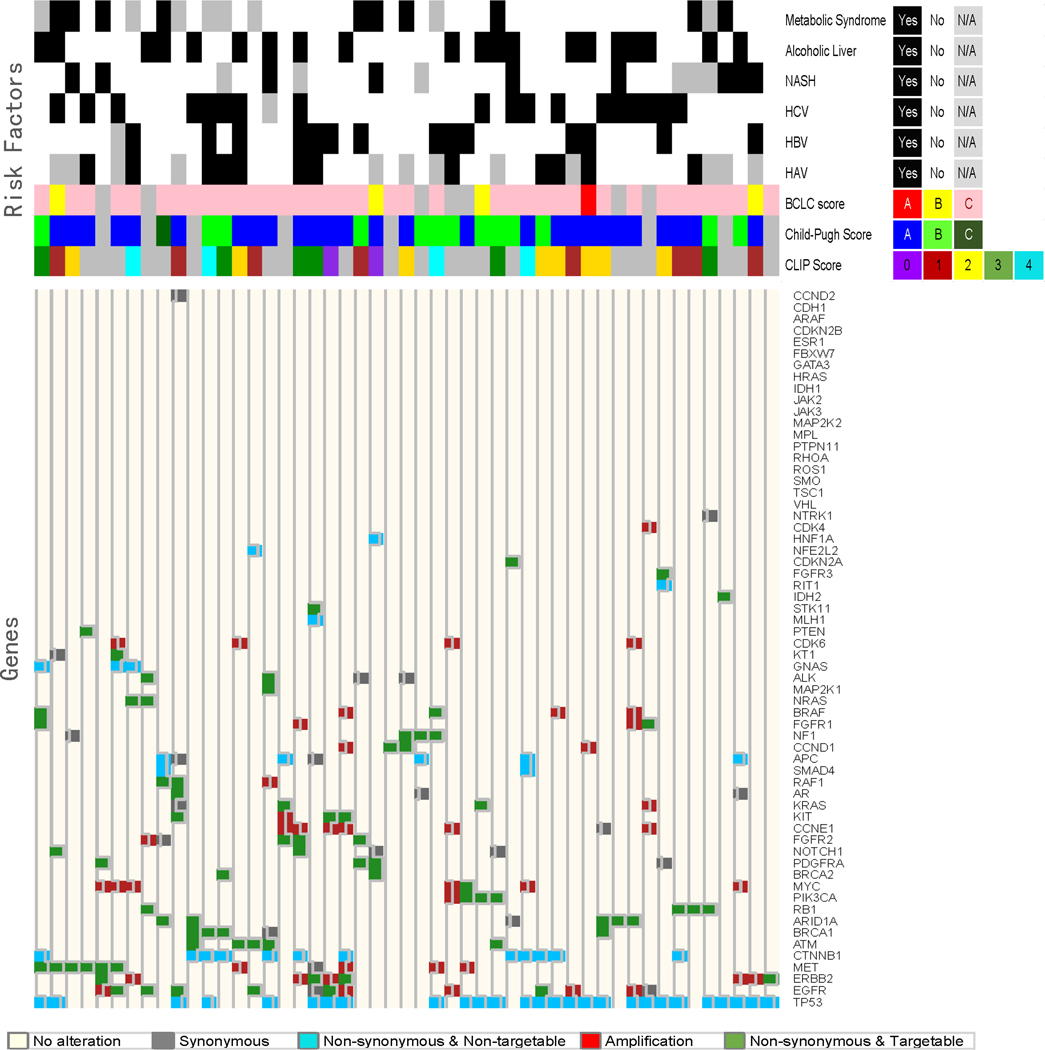
Figure 5:
Correlation between molecular landscape and risk factors contributing to HCC. Heat map dendrogram was generated to explore and visualize the gene mutation/amplification relationship along with the corresponding various risk factors. The relationship between gene types with regard to mutation and amplification, synonymous and targetable status was evaluated with Spearman’s rank correlation and displayed in the correlation matrix in which the non-significant correlations are marked with “blank” in the graph.

