
Figure 5.
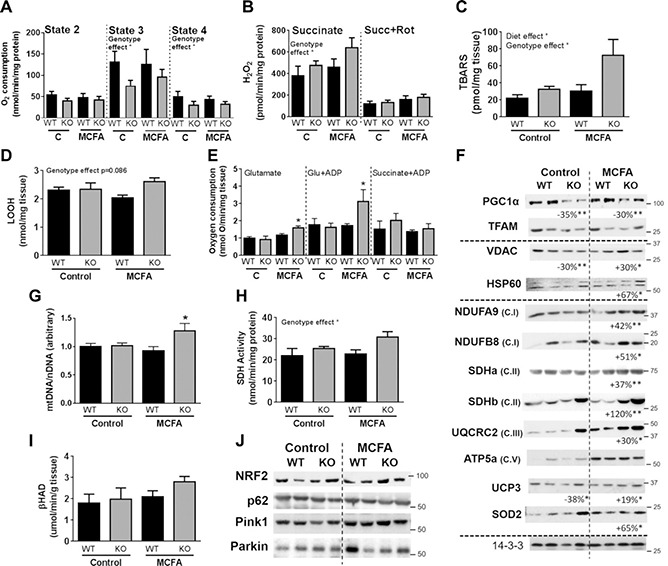
Skeletal muscle metabolic characterization of Gpr84 KO mice and their WT littermates, fed either a chow diet (control) or an MCFA‐enriched high‐fat diet for 8 wk. A‐D) Succinate‐driven state 2, 3, and 4 respiration in isolated mitochondria (A), hydrogen peroxide generation in isolated mitochondria in the presence of succinate or succinate and rotenone (B), as well as determination of TBARS (C) and LOOH content in whole muscle homogenates (D). E) Respiration of intact muscle fibers in the presence of glutamate, glutamate and ADP, and succinate and ADP. F) Immunoblotting analysis of various markers of mitochondrial capacity. Representative immunoblots show n = 2/group; however, indicated percentage changes and statistical significance refer to n = 8/group. G—I) Mitochondrial DNA/nuclear DNA ratio as an indicator of mitochondrial content (G), SDH (H), and β‐HAD activity (I) in muscle lysates. J) Immunoblotting analysis of autophagy regulators/markers in whole quad lysates. Shown are means ± sem, n = 7‐10 mice/assessment/group. Statistical differences were determined by 2‐way ANOVA followed by Bonferroni post hoc test; or by Student's t test for the immunoblotting analysis.