Figure 2.

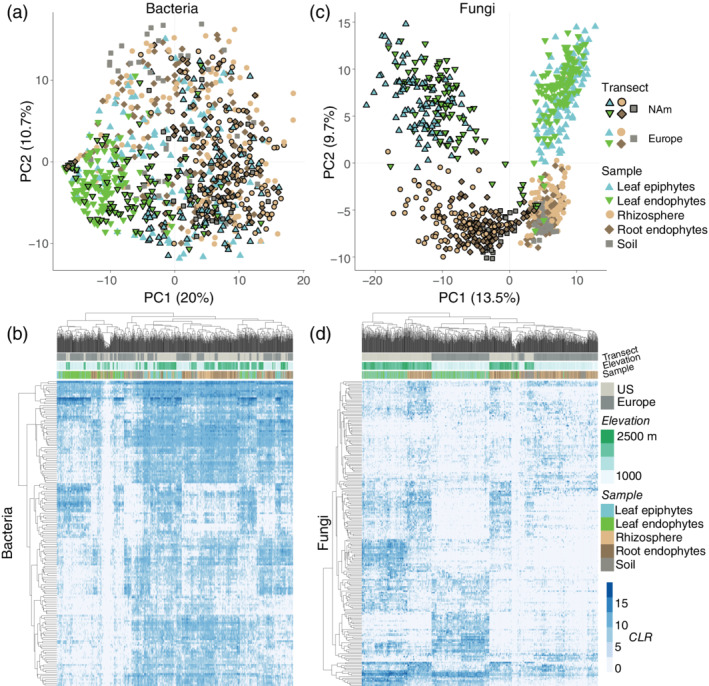
The structure of the wild strawberry microbiome. (a) PC1 and PC2 from PCA of the bacterial community (top n = 250 phylotypes), after center log ratio (CLR) transformation. (b) The distribution of the top bacteria within the soil, root and leaf microbiome. (c) PC1 and PC2 from PCA of the fungal community, as in panel a. (d) The distribution of the top fungi in the soil, root and leaf microbiome. The samples from North America are drawn with a black border in panels a and c [Colour figure can be viewed at wileyonlinelibrary.com]
