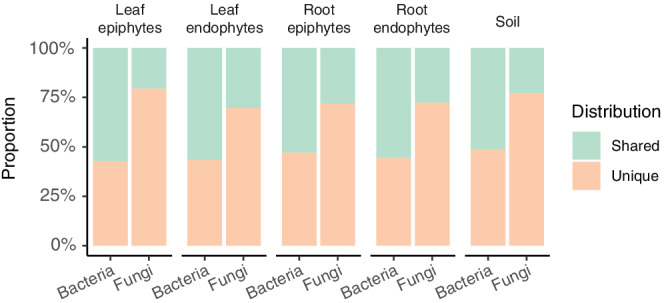
Figure 3.

Differences in the distribution of bacteria and fungi. The proportion of bacteria and fungi that are shared or unique across transects, focusing on the top 250 taxa within each community [Colour figure can be viewed at wileyonlinelibrary.com]
