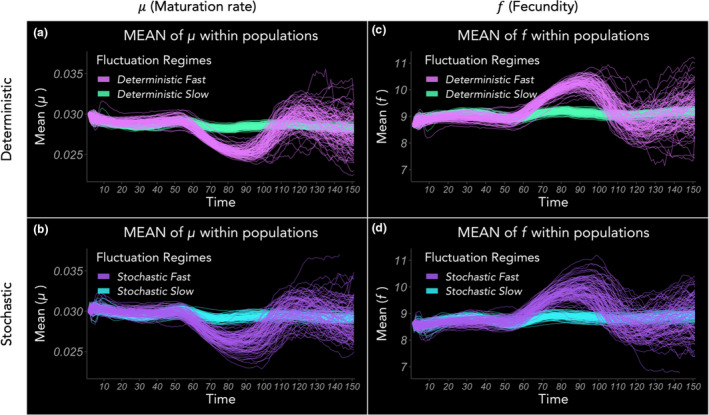
FIGURE 2.

Means of life‐history traits evolving in simulated populations. (a, b) show evolving mean of (maturation rate) in deterministic and stochastic regimes, respectively; (c, d) show evolving mean of f (fecundity) in deterministic and stochastic regimes, respectively. Each scenario is repeated for 100 realisations
