
. 2021 Sep 23;29(1):149–157. doi: 10.1111/ene.15102
© 2021 The Authors. European Journal of Neurology published by John Wiley & Sons Ltd on behalf of European Academy of Neurology.
This is an open access article under the terms of the http://creativecommons.org/licenses/by-nc/4.0/ License, which permits use, distribution and reproduction in any medium, provided the original work is properly cited and is not used for commercial purposes.
FIGURE 2.
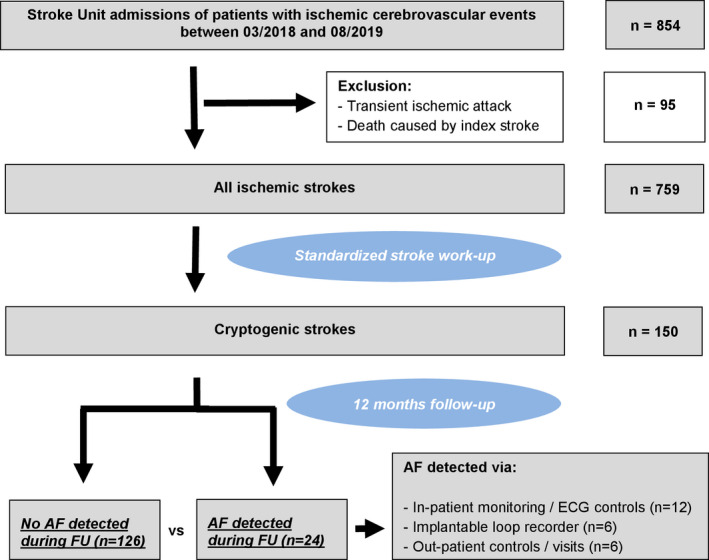
Flow diagram of selected study participants