
Fig 5.
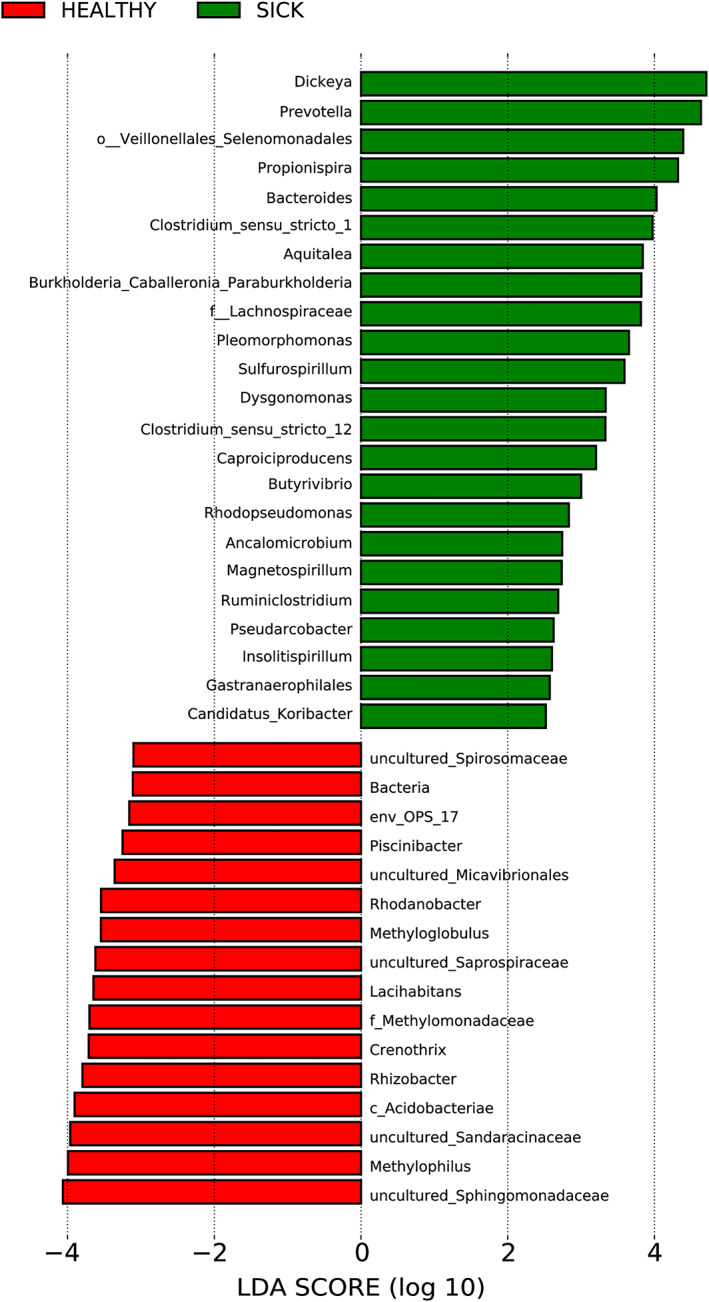
Linear discriminant analysis (LDA) scores of the main bacterial genera which significantly differ in their relative abundance between asymptomatic (HEALTHY) and symptomatic (SICK) samples. Differential abundance of bacterial genera between two groups of samples tested was assessed by performing a linear discriminant analysis (LDA). The two‐symptomatology conditions were used as class to test. Only genera with a P value < 0.05 for the Kruskal–Wallis test and an LDA score > 2 are displayed. An extended version of this plot is available as Fig. S7.