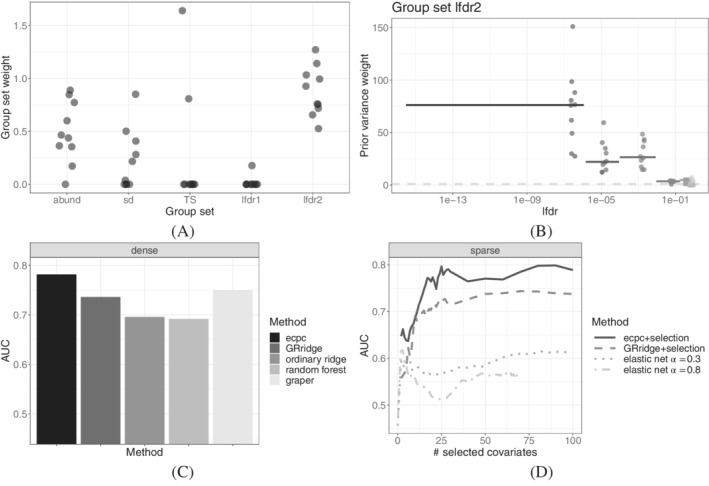
FIGURE 5.

Results of 10‐fold CV in miRNA data example. (A) Estimated co‐data group set weights across folds; (B) estimated local prior variance weight in lfdr2 for different continuous lfdr values across folds. The horizontal line segments indicate the median local prior variance in the leaf groups of the hierarchical tree illustrated in Figure 4, ranging from the minimum to maximum lfdr‐value in that group. The points indicate the estimates across folds, jittered along the median lfdr‐value in the leaf groups. The dashed line at 1 corresponds to ordinary ridge weights for non‐informative co‐data. A larger prior variance corresponds to a smaller penalty; (C) AUC in various dense models; (D) AUC in various sparse models
