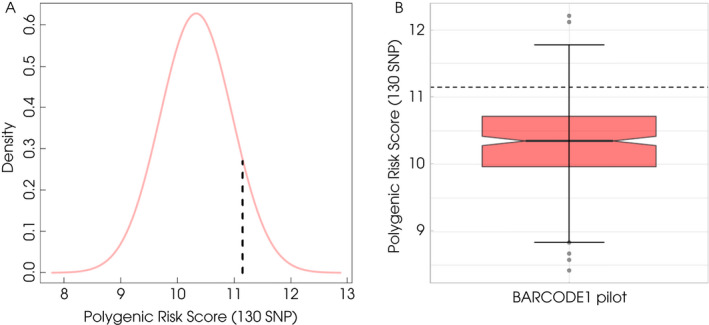
Fig. 3.

PRS distribution in BARCODE1 Pilot. (A) The dashed line denotes the 90th centile PRS value (11.15). (B) Boxplot of the PRS distribution in BARCODE1 pilot displaying minimum and maximum values of PRS in whole study cohort as well as outliers. The dashed line denotes the 90th centile PRS value (11.15).
