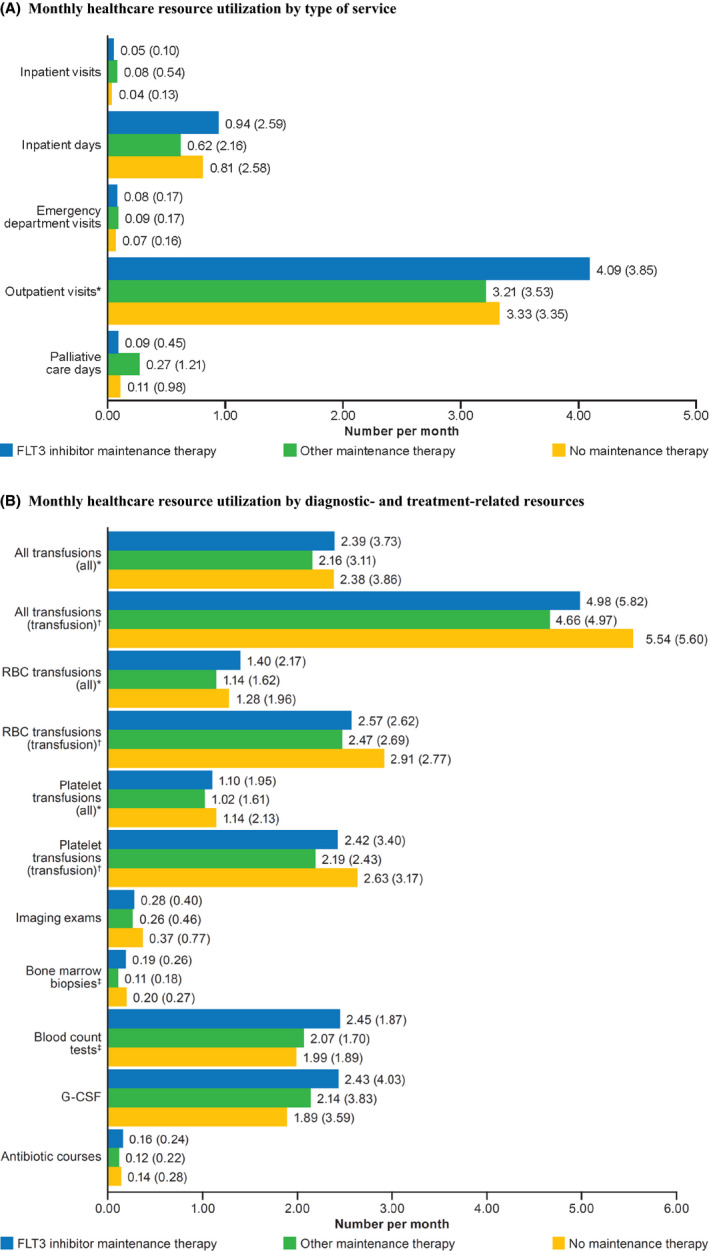
FIGURE 1.

Monthly healthcare resource utilization for patients post‐HSCT receiving FLT3 maintenance therapy, other maintenance therapy, or no maintenance therapy. A, The monthly healthcare resource utilization by type of service (inpatient, outpatient, emergency department, or palliative care) identified using number of days or visits is shown in the bar graph. Abbreviations: CI, confidence interval; ED, emergency department; FLT3, Fms‐like tyrosine kinase 3; G‐CSF, granulocyte colony‐stimulating factor; HRU; healthcare resource utilization; IRR, incidence rate ratio; RBC, red blood cell. Numbers at the end of bars indicate means (standard deviations), representing continuous variables. Bolded numbers in inset table indicate statistical significance at P < .05. *Significantly different between maintenance therapy groups, P < .05. B, The healthcare resource utilization by diagnostic‐ and treatment‐related resources identified using the number of each resource used per month is shown in the bar graph. Numbers at the end of bars indicate means (standard deviations), representing continuous variables. Bolded numbers in inset table indicate statistical significance at P < .05. †Analysis of all patients receiving transfusions on a monthly basis for the entire study period. ‡Analysis of only patients receiving transfusions on a monthly basis for the entire study period. §Significantly different between maintenance therapy groups, P < .05
