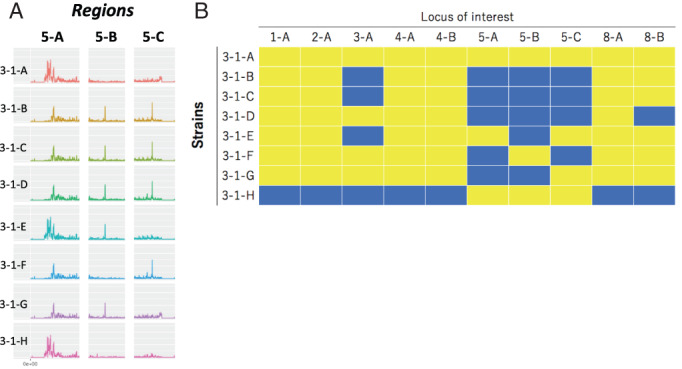
Fig. 5.

Differences in patterns of single nucleotide polymorphism (SNP) frequency among the strains isolated from a single tulip bulb.
A. The SNP presence patterns are compared in certain regions on chromosome 5 (5‐A, 5‐B and 5‐C).
B. The patterns in each region could typically be divided into two groups, which are indicated by yellow or blue panels. Ten genomic loci are shown and compared among the eight strains.
