Figure 3.

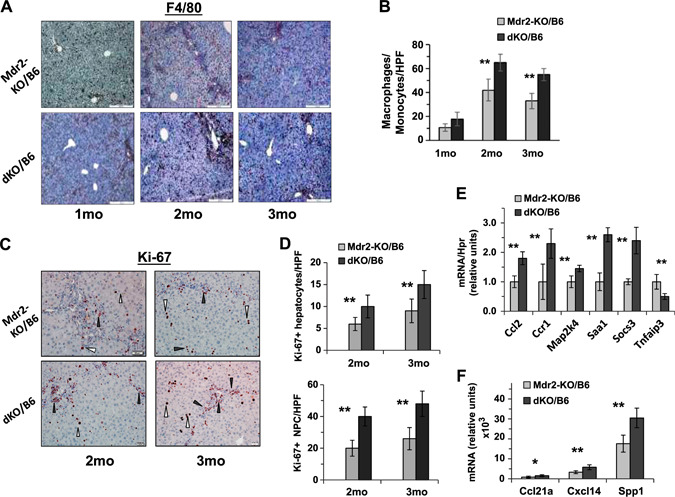
Increased inflammation and proliferation of liver cells in dKO/B6 vs. Mdr2‐KO/B6 livers. A) F4/80 immunostaining in the Mdr2‐KO/B6 (top panel) and dKO/B6 (bottom panel) livers. Red‐brown signals distributed in the tissue represent F4/80+ monocytes and macrophages. Original magnification, ×100; scale bars, 50 μm. B) Quantification of F4/80+ cells as presented in A in Mdr2‐KO and dKO livers (mean of 5–6 males per each experimental group; 10 images were collected and analyzed per mouse). C) Ki67 immunostaining in the livers of 2‐ and 3‐mo‐old Mdr2‐KO/B6 and dKO/B6 mice. White triangles point to hepatocytes and black triangles to nonparenchymal (NPC) cells. Original magnification, ×200; scale bars, 20 μm. D) Quantification of Ki67‐positive hepatocytes (upper graphs) and Ki67‐positive nonparenchymal cells (bottom graphs) as presented in C. The counting was performed in the liver zone 2 for hepatocytes and zone 1 (periportal region) for NPC in the original magnification, ×400 field; n = 3–5 mice/genotype. Means ± sd. *P < 0.05, **P < 0.01 in dKO vs. Mdr2‐KO mice (Student's t test). E, F) Expression of genes associated with inflammation in the liver of 2‐mo‐old Mdr2‐KO and dKO mice assigned by either quantitative RT‐PCR (E) or by Nanostring assay (F). There were 4–6 mice for each time point. Results are presented as a means ± sd. *P < 0.05, **P < 0.005 (Student's t test).
