Figure 4.

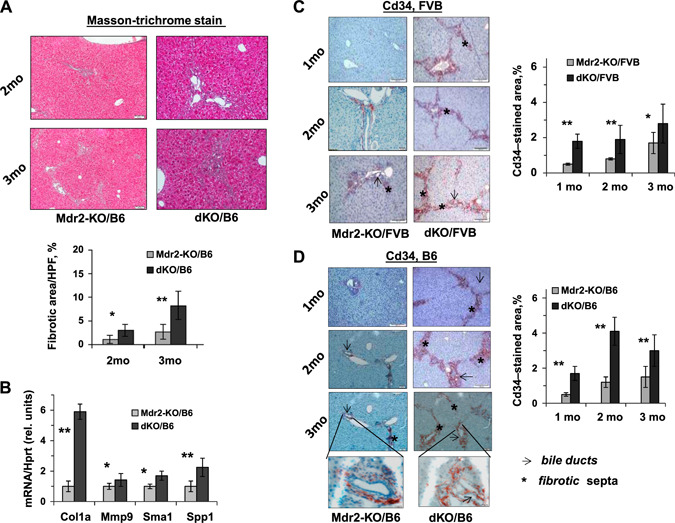
Increased severity of fibrogenesis in dKO/B6 vs. Mdr2‐KO/B6 livers at young age. A) Masson's trichrome stain and morphometric assessment of Masson's trichrome stained areas in Mdr2‐KO and dKO livers using ImageJ Software. Original magnification, ×100; scale bars, 50 μm; n= 4–5 mice/genotype. The values are means ± sem. *P < 0.05, **P < 0.01 for dKO vs. age‐matched Mdr2‐KO mice. B) Increased hepatic expression of the fibrogenesis‐ and billiary‐related genes in dKO compared with Mdr2‐KO/B6 murine livers at the age of 2 mo (n = 3–5 mice/genotype). Means ± sd. *P < 0.05, **P < 0.01 for dKO vs. Mdr2‐KO mice (Student's t test). C, D) IHC of CD34 and its quantification by morphometric analysis in the Mdr2‐KO and dKO mouse livers from FVB (C) and B6 (D) genetic backgrounds. Multiple CD34+ cells were observed in fibrotic septa (stars) and around bile ducts (arrows) in dKO vs. Mdr2‐KO livers (red‐brown color); n = 4–6 mice/genotype. Counting per ×20 power field. Original magnification: ×100; scale bars, 50 μM; inserts (D), ×600; scale bars, 10 μM.
