Figure 7.

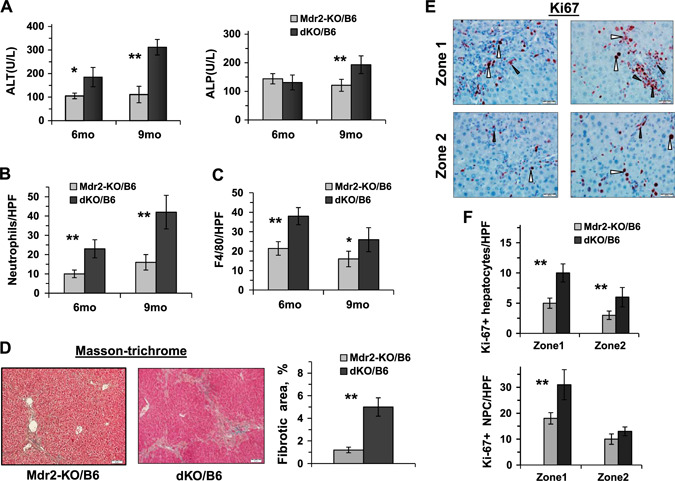
Increased liver inflammation and fibrosis in the middle‐aged dKO/B6 vs. Mdr2‐KO/B6 mice. A) ALT and ALP activity in the serum of Mdr2‐KO/B6 and dKO/B6 males 6 and 9 mo of age (5–8 mice for each time point and genotype). Means ± sd. *P < 0.05, **P < 0.01 in dKO vs. Mdr2‐KO mice (Student's t test). B, C) Quantification of Ly6G‐positive (B) and F4/80‐positive (C) leukocytes in the liver of dKO vs. Mdr2‐KO mice. The representative images are shown in Supplemental Fig. S4C and D, respectively. D) Masson's trichrome staining of the liver of 6‐mo‐old B6 dKO and Mdr2‐KO males and its quantification by morphometric analysis. Original magnification, ×100; scale bars, 50 μm. E) Representative immunohistochemical staining of the livers of 6‐mo‐old Mdr2‐KO and dKO B6 males using Ki67‐specific antibody. Hepatocytes are marked by white arrowheads and nonparenchymal cells (NPCs) by black arrowheads. Original magnification, ×400; scale bars, 20 μM. F) Quantification of Ki67‐positive hepatocytes and Ki67‐positive NPC. The counting was performed in liver zones 1 (periportal region) and 2 (middle zone) for all tested liver sections; n = 3–5 mice/genotype. Means ± sd. *P < 0.05, **P < 0.01 in dKO vs. Mdr2‐KO mice (Student's t test).
