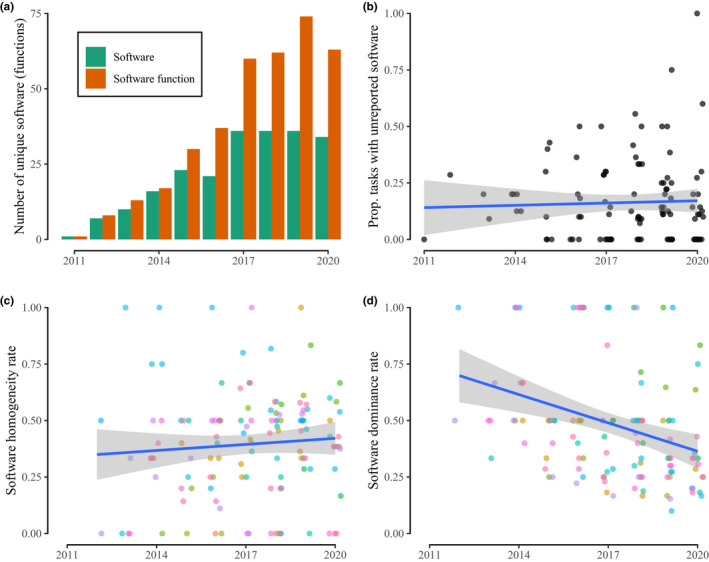
FIGURE 5.

Consistency in software reporting and use over time. (a) The total number of unique software functions reported across all papers for each year of publication. (b) For each paper, the proportion of the total number of bioinformatic tasks for which the software used for a task was not reported. (c) The software homogeneity rate, calculated only when more than one paper reported a task in a given year. A value of 1 means all papers used the same tool for a given task in a given year. (d) The software dominance rate, calculated only when more than one paper reported a task in a given year. A value of 1 means all papers used the same tool for a given task in a given year. (b–d) Best fit regression lines are shown in blue with shaded 95% confidence intervals around the line. Horizontal jitter added to points to illustrate density within years; (c and d) colours denote different tasks, see Figure S1
