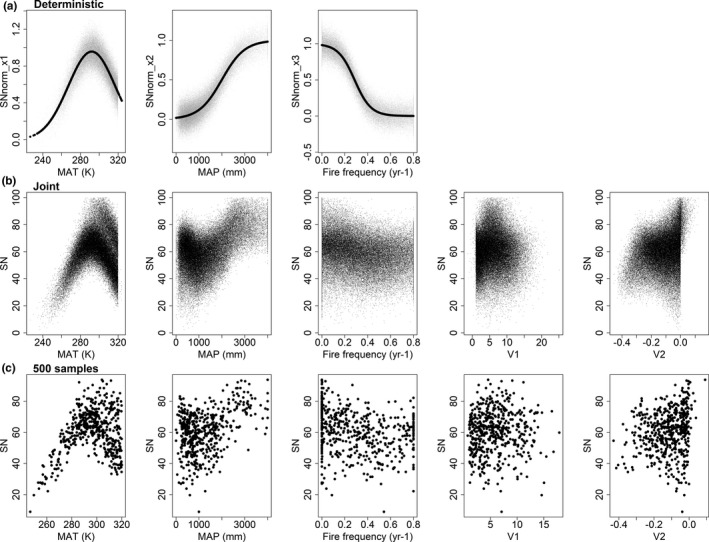
FIGURE 1.

Simulated relationships between species richness for a hypothetical taxon and five environmental predictor variables. The upper row (a) shows the deterministic bivariate relationships (dark line) used to simulate species richness (Equation 1), with additional Gaussian noise (grey points). Row (b) shows the final species richness (SN, Equation 2) along the five predictors under ‘data‐rich’ scenario (N = 64,454). Row (c) illustrates the additional challenge inherent in modelling data‐poor situations, showing 500 samples randomly selected from row (b)
