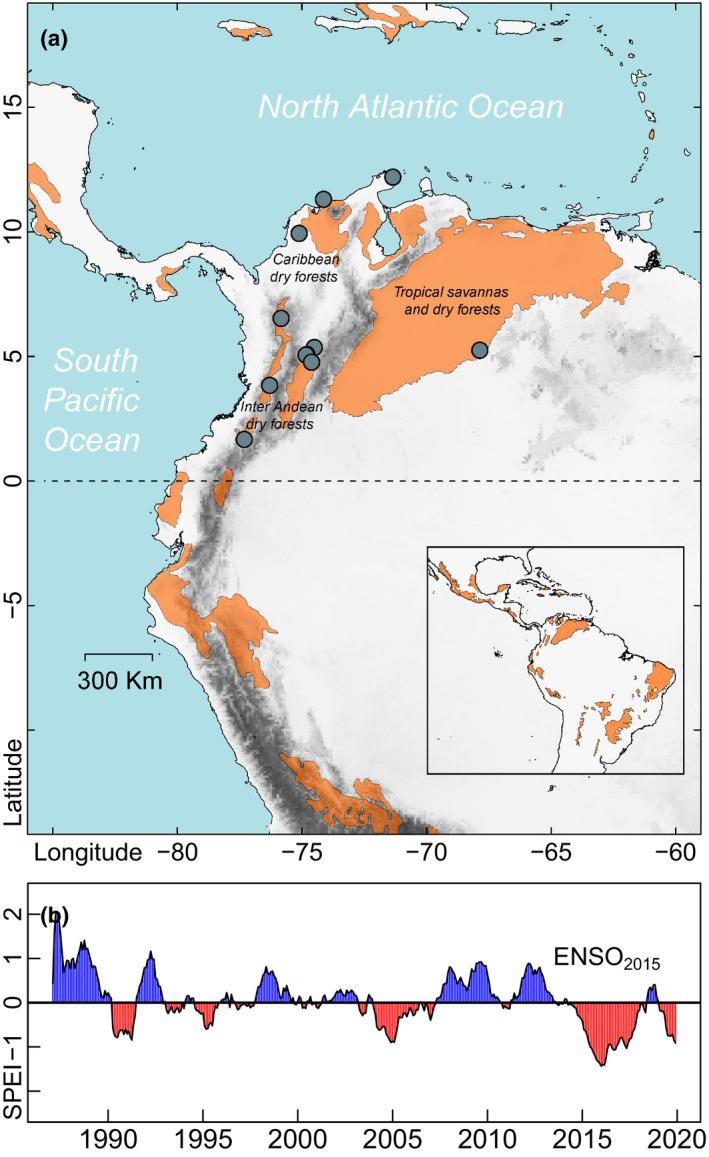
Figure 2.

Geographical distribution and average inter‐annual drought regimes of the study sites. (a) Distribution of dry ecosystems in Northern South America (orange area, adapted from Pennington et al., 2018). Blue circles indicate the location of the 11 1‐ha permanent plots installed for monitoring mature forests across the region. (b) The Standardised Precipitation‐Evapotranspiration Index (SPEI; Vicente‐Serrano et al., 2012) was calculated based on long‐term data from weather stations near the plots (1980–2019). SPEI determines the magnitude and strength of drought conditions during the period of analysis, where negative values indicate the SPEI mean for drought periods (red colour) and positive values correspond to wet periods (blue colour). All plots experienced the extreme ENSO2015 (red area between 2015 and 2016). For extended details see Table S1 in supporting information
