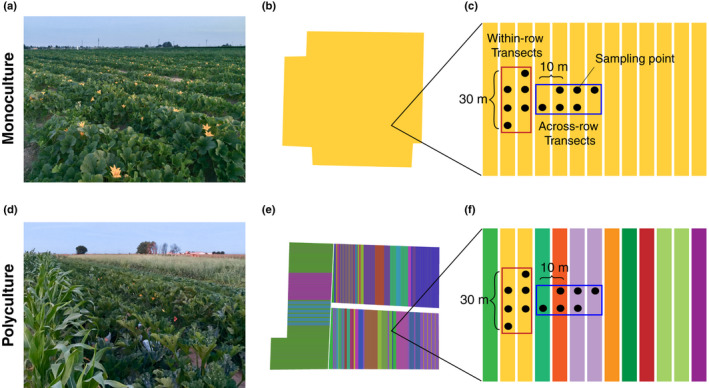
Fig. 1.

Representative images, row‐level crop maps and sampling scheme of monoculture fields (a–c) and polyculture fields (d–f). The row‐level crop maps (b, e) were hand‐digitized and each color represents a different crop type. The sampling scheme panels for monoculture (c) and polyculture (f) fields illustrate that samples collected from within‐row transects were always the same crop type (i.e. focal crop, eggplant or squash) and from across‐row transects were the same crop type on monocultures or distinct crop types on polycultures.
