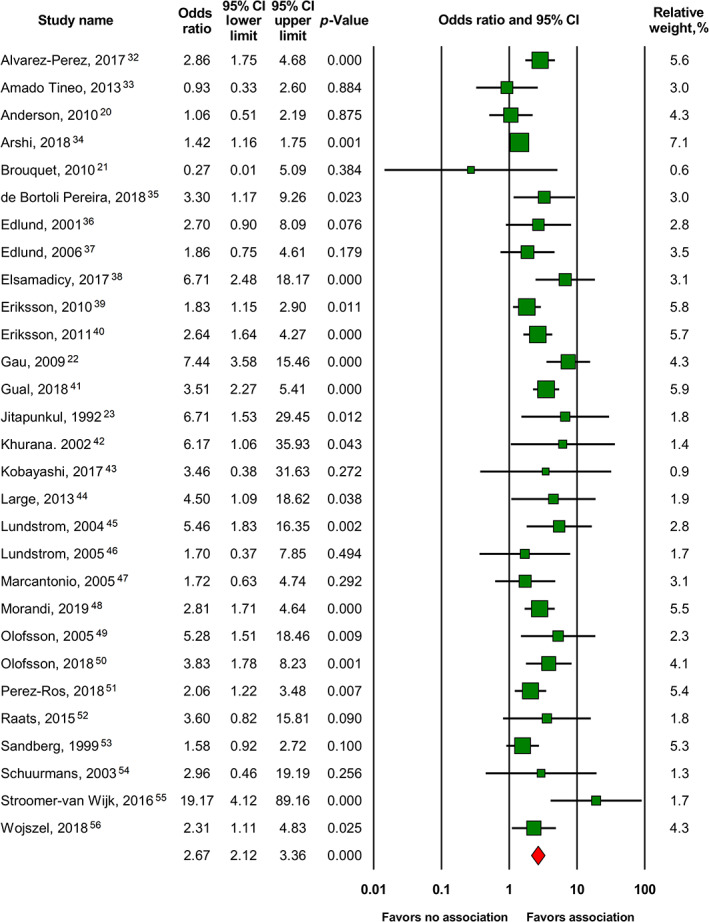
FIGURE 2.

Forest plot of the main meta‐analysis of 29 studies 20 , 21 , 22 , 23 , 32 , 33 , 34 , 35 , 36 , 37 , 38 , 39 , 40 , 41 , 42 , 43 , 44 , 45 , 46 , 47 , 48 , 49 , 50 , 51 , 52 , 53 , 54 , 55 , 56 expressing associations between delirium and UTI in older adults. 95% CI, 95% confidence interval
