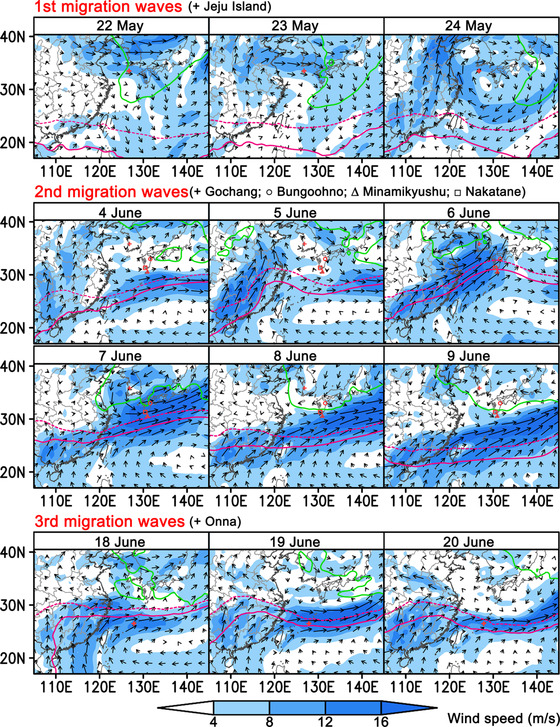
Fig. 5.

The wind pattern (vector shows wind direction and speed, and filled color shows wind speed) and temperature (green line shows 13.8 °C isotherm) at the level of 850 hPa (∼1500 m above sea level) around possible take‐off or arrival time during the migration period. The range of western Pacific subtropical high pressure is presented using the 500‐hPa geopotential height contour (geopotential decameter, gpdm). Red solid lines represent the 588‐gpdm contour, red dash lines represent the 586‐gpdm contour. GS(2021)3135.
