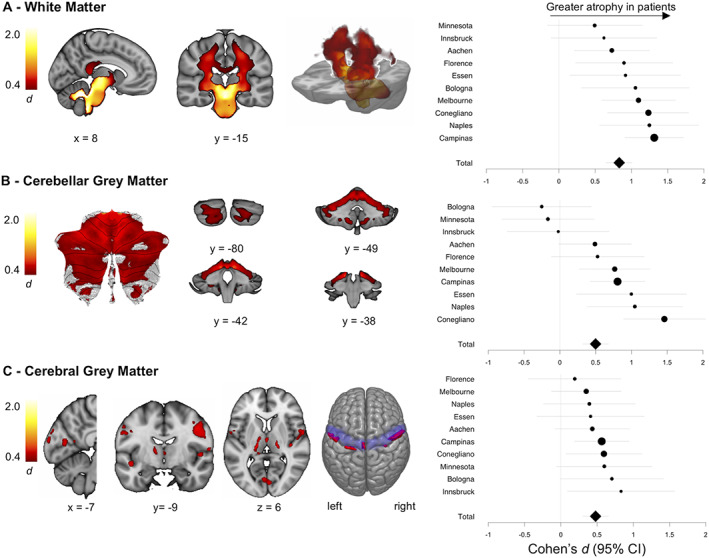
FIGURE 2.

Voxel‐level effect size (Cohen d) maps of individuals with Friedreich ataxia versus controls, statistically controlling for site, intracranial volume, sex, age, disease onset, and disease duration. Only voxels that survive voxelwise p FWE < 0.05 are displayed. Forest plots of mean effect size within these regions (Cohen d ± 95% confidence interval [CI]) for each site are given on the right, and the size of the point estimate is proportional to the sample size of the site (Supplementary Table S4). (A) White matter (cerebral and cerebellar). (B) Cerebellar gray matter. (C) Cerebral gray matter. The primary motor cortex (precentral gyri) is depicted on the superior surface. Slice coordinates are in Montreal Neurological Institute space. [Color figure can be viewed at www.annalsofneurology.org]
