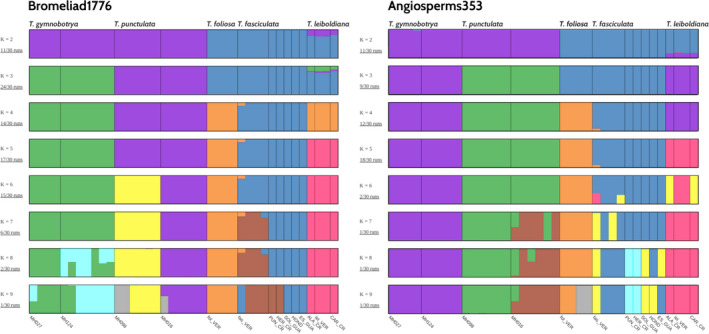
FIGURE 4.

Population structure of 5 Tillandsia subgenus Tillandsia species from 14 sampling locations inferred with the ADMIXTURE software. Samples were enriched with either of two bait sets: Angiosperms353 (9804 variants after LD‐pruning) and Bromeliad1776 (42,613 variants after LD‐pruning), showing values of K = 2 to K = 9. Colours represent genetically differentiated groups, while each accession is represented by a vertical bar
