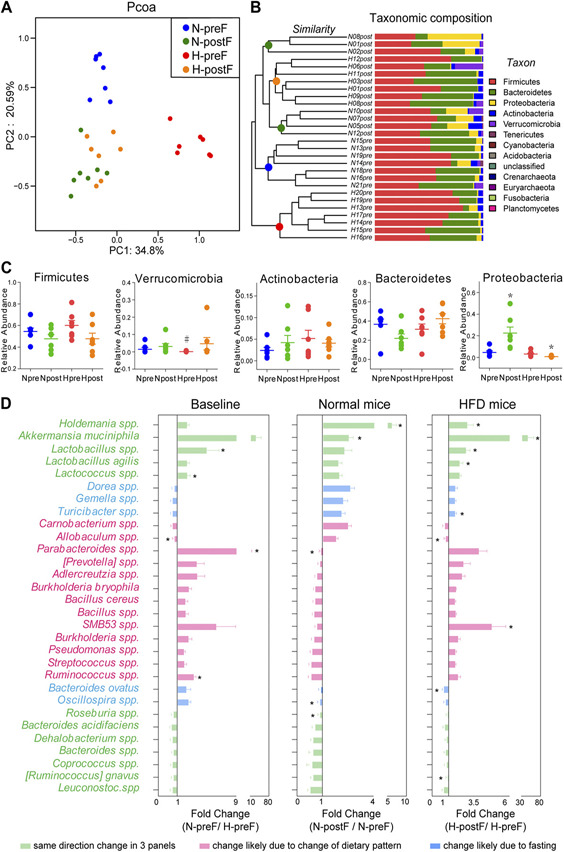
Figure 2.

Effects of food withdrawal on cecal microbiota. A) PCOA plot generated by using microbiota OTU metrics based on the Bray‐Curtis similarity for the N‐preF, N‐postF, H‐preF, and H‐postF groups (n = 7/group). B) The hierarchical cluster based on the Bray‐Curtis similarity of the samples from the N‐preF, N‐postF, H‐preF, and H‐postF groups. The bar plot shows the abundance of each phylum in each sample. C) The 5 most abundant phyla in the N‐preF, N‐postF, H‐preF, and H‐postF groups. Data are expressed as means ± sem. Group differences were assessed by using the Mann‐Whitney U test. *P < 0.05 when comparing N‐postF vs. N‐preF, or H‐postF vs. H‐preF, #P < 0.05 when comparing N‐preF vs. H‐preF. D) Fold changes of the annotated microbes at the genus or species level. Data are expressed as means ± sem. Group differences were assessed by using the Mann‐Whitney U test. *P < 0.05.
