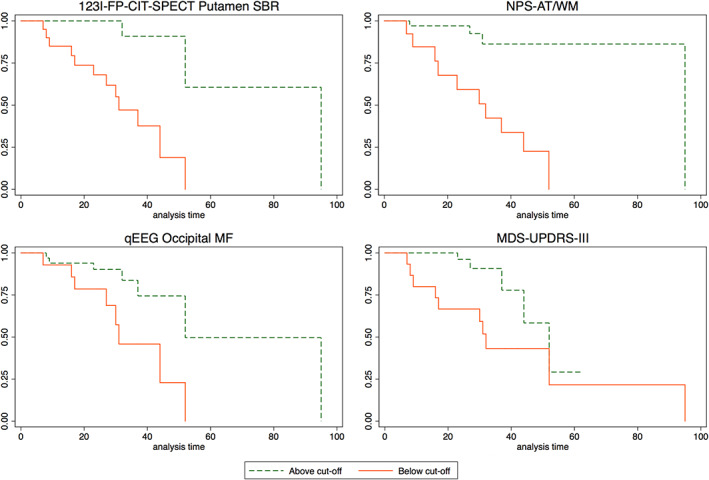
FIG 1.

Kaplan–Meier disease‐free survival plot of iRBD patients according to the best predictors of phenoconversion. For each feature, red solid lines indicate patients below cut‐off and green dashed lines indicate patients above cut‐off. [Color figure can be viewed at wileyonlinelibrary.com]
