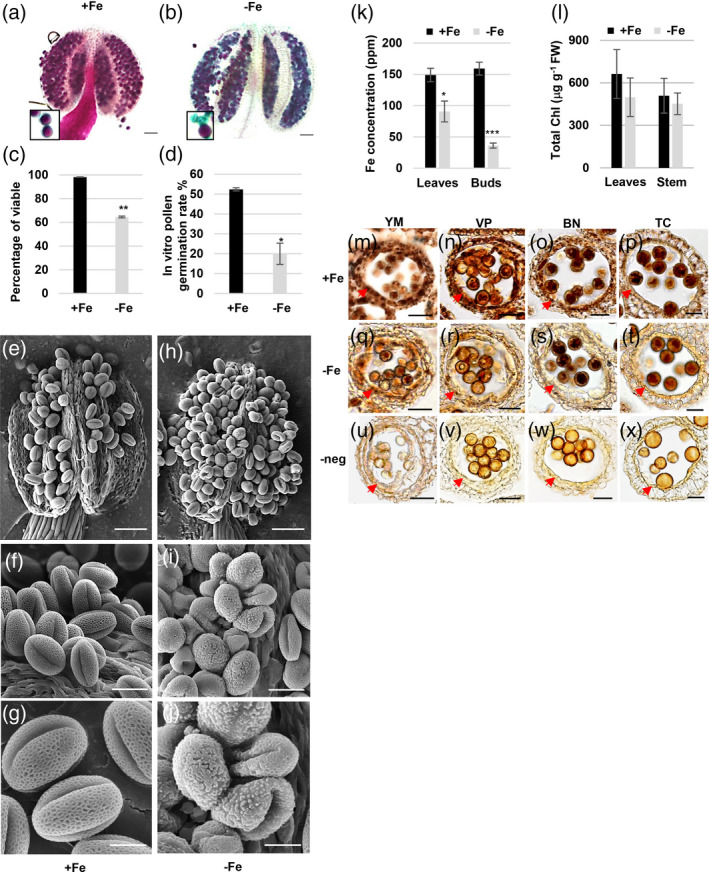
Figure 1.

The changes in the viability and morphology of pollen, Fe content, and chlorophyll content under Fe deficiency.
(a, b) The viability of pollen in anthers of plants grown for 18 days after transplantation to Fe‐sufficient (+Fe, a) and ‐deficient (−Fe, b) conditions was analyzed using Alexander staining. Bars = 50 μm. The enlarged areas show viable pollen (purple) and non‐viable pollen (blue‐green). (c) The percentage of viable pollen was scored from anthers stained with Alexander stain. (d) The percentage of pollen that germinated was scored. Data are shown as mean ± standard error of three independent experiments. *P < 0.05, **P < 0.01 between −Fe and +Fe conditions (Student’s t‐test). (e–j) Cryo‐SEM images of mature pollen in the dehiscent anthers of plants grown under +Fe (e–g) and −Fe (h–j) conditions. Bars = 50 μm in (e and h), 20 μm in (f and i), and 10 μm in (g and j). (k) Fe concentration in leaves and floral buds from plants grown under Fe‐sufficient (+Fe) and ‐deficient (−Fe) conditions was analyzed by ICP‐MS. (l) Chlorophyll (Chl) content in rosette leaves and inflorescence stems from plants grown under +Fe and −Fe conditions. Data are shown as mean ± standard error of three independent experiments. *P < 0.05, ***P < 0.005 between −Fe and +Fe anthers (Student’s t‐test). (m–x) Sections of anthers from plants grown under +Fe (m–p) and −Fe (q–t) conditions were stained with Perls/DAB. Bars = 20 μm. (u–x) Sections of anthers from plants grown under +Fe conditions were stained with DAB alone as a negative control (‐neg). The arrows in panels (m) to (x) indicate the tapetum. YM, young microspore; VP, vacuolated pollen; BN, binucleate pollen; TC, tricellular pollen.
