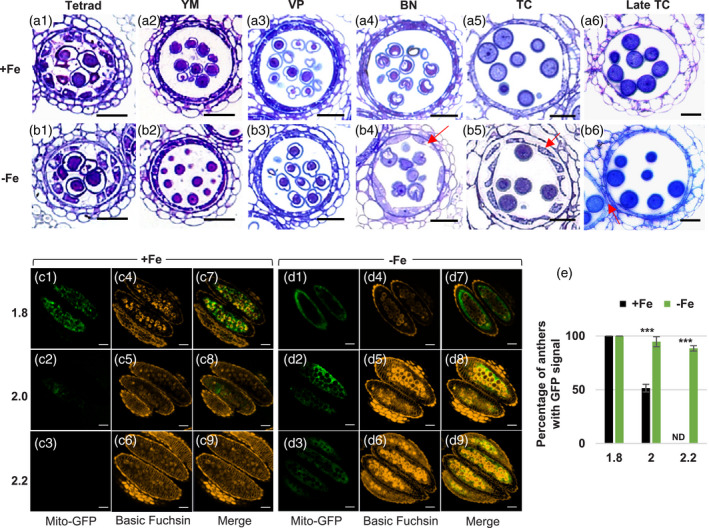
Figure 2.

The morphology and degeneration of the tapetum under Fe deficiency.
(a, b) Semi‐thin sections of anthers from plants grown under Fe‐sufficient (a1–a6) and ‐deficient (b1–b6) conditions. The arrows in (b4 and b5) indicate abnormal tapetum morphology. The arrow in (b6) indicates the degenerating septum. Bars = 20 μm in (a1–b6). YM, young microspore; VP, vacuolated pollen; BN, binucleate pollen; TC, tricellular pollen. (c, d) Anthers showing tapetum‐specific expression of mito‐GFP from 1.8‐, 2.0‐, and 2.2‐mm buds of Fe‐sufficient (+Fe, c) and ‐deficient (−Fe, d) plants were examined. Basic Fuchsin was used to stain lignin to differentiate anther stage in (c4–c6 and d4–d6). (c7–c9 and d7–d9) are merged images of mito‐GFP and Basic Fuchsin. Bars = 50 μm. (e) Quantification of the percentage of anthers with GFP signals (n > 10). Data are shown as mean ± standard error of three independent experiments. ***P < 0.005 between −Fe and +Fe conditions (Student’s t‐test). ND, not detected.
