Figure 4.

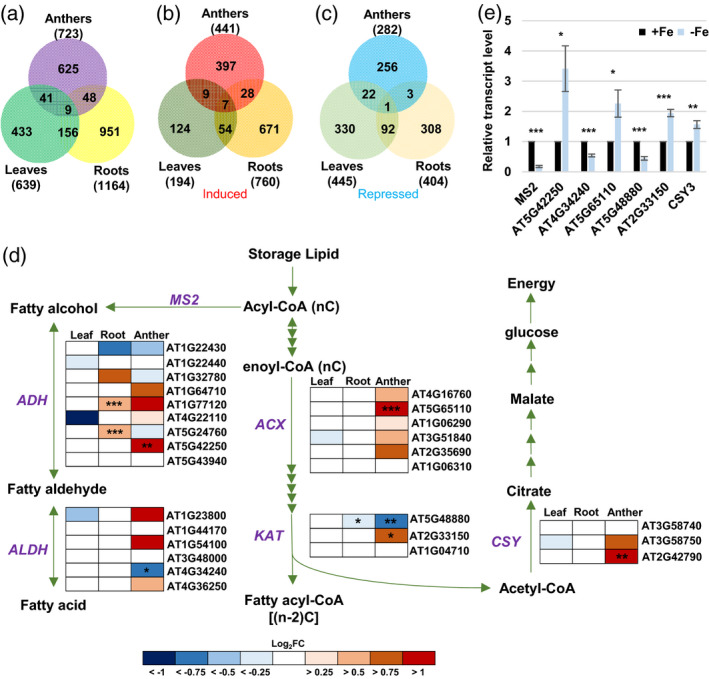
Analysis of Fe deficiency‐responsive genes and genes involved in the fatty acid degradation pathway.
(a–c) Venn diagrams of total (a), induced (b), and repressed (c) DEGs in Fe‐deficient anthers, leaves, and roots (P.adj < 0.05). (d) Changes in expression of genes involved in the fatty acid degradation pathway (P = 0.00377) under Fe deficiency. MS2, MALE STERILITY 2; ADH, alcohol dehydrogenase; ALDH, aldehyde dehydrogenase; ACX, acyl‐CoA oxidase; KAT, 3‐ketoacyl‐CoA thiolase; CSY, citrate synthase. Enrichment analysis of anther DEGs was performed using EXPath 2.0. Boxes indicate relative expression changes in genes encoding enzymes. Log2FC, log2(fold change of expression levels) from RNA‐seq data in Fe‐deficient (−Fe) versus ‐sufficient (+Fe) tissues. *P.adj < 0.05, **P.adj < 0.01, ***P.adj < 0.001 between −Fe and +Fe conditions. (e) Comparison of transcript levels of genes from panel (d) between anthers from −Fe and +Fe plants as analyzed by qPCR. Data are shown as mean ± standard error of three independent experiments. *P < 0.05, **P < 0.01, ***P < 0.001 between −Fe and +Fe anthers (Student’s t‐test).
