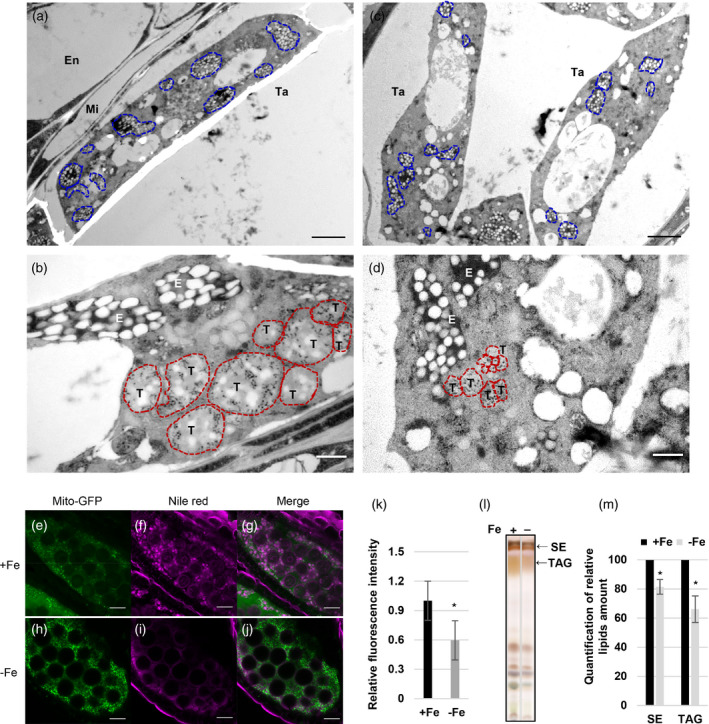
Figure 5.

Tapetosomes, elaioplasts, and neutral lipid content in anthers under Fe deficiency.
(a–d) Fe‐sufficient (+Fe, a and b) and Fe‐deficient (−Fe, c and d) tapetal cells at the BN stage were observed using TEM. Blue (a and c) and red (b and d) dash lines indicate elaioplasts and tapetosomes, respectively. Bars = 2 μm (a and c) and 0.5 μm (b and d). Ta, tapetum; Mi, middle layer; En, endothecium; T, tapetosome; E, elaioplast. (e–j) Arabidopsis anthers showing tapetum‐specific expression of mito‐GFP from +Fe (e–g) and −Fe (h–j) plants were stained with Nile red (f, i) at the TC stage. (g and j) The merged images of mito‐GFP and Nile red. Bars = 20 μm. (k) Quantification of relative (versus WT under +Fe) Nile red fluorescence intensity of the tapetum (n > 10). (l) Lipids were extracted from anthers of Brassica napus and separated by TLC. SE, sterol ester; TAG, triacylglycerol. (m) Quantification of relative (versus WT under +Fe) amounts of SE and TAG in panel (l). Data are shown as mean ± standard error of three independent experiments. *P < 0.05, **P < 0.01 between −Fe and +Fe conditions (Student’s t‐test).
