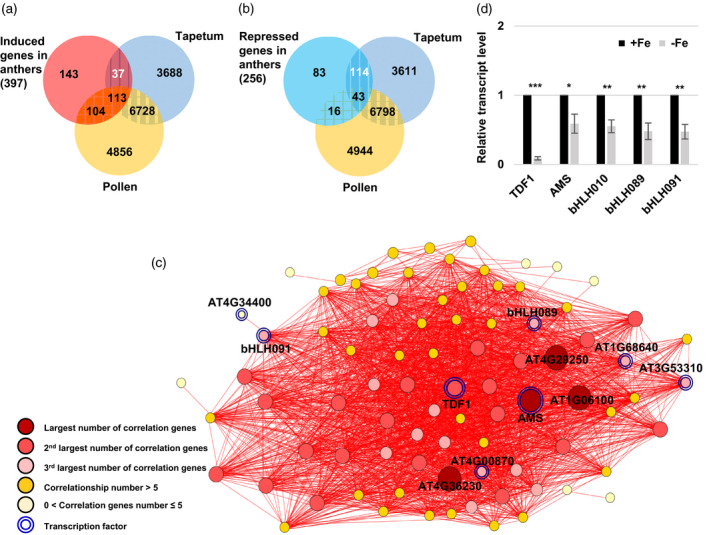
Figure 6.

Identification and analysis of tapetum‐unique DEGs under Fe deficiency.
(a, b) Venn diagrams showing the overlap of induced (a) and repressed (b) DEGs (P.adj < 0.05) in Fe‐deficient anthers with genes detected in the tapetum and mature pollen transcriptomes. (c) Tapetum‐unique DEGs (37 upregulated plus 114 repressed DEGs in panels (a) and (b)) were selected for co‐expression analysis. Each node represents a gene. Two genes connected by a red line indicate a significant positive correlation (Pearson’s correlation coefficient > 0.80) across different conditions determined using EXPath 2.0. (d) Relative transcript levels of TDF1, AMS, bHLH089, bHLH091, and bHLH010 in anthers between −Fe and +Fe plants as determined by qPCR. Data are shown as mean ± standard error of three independent experiments. *P < 0.05, ***P < 0.001 between −Fe and +Fe anthers (Student’s t‐test).
