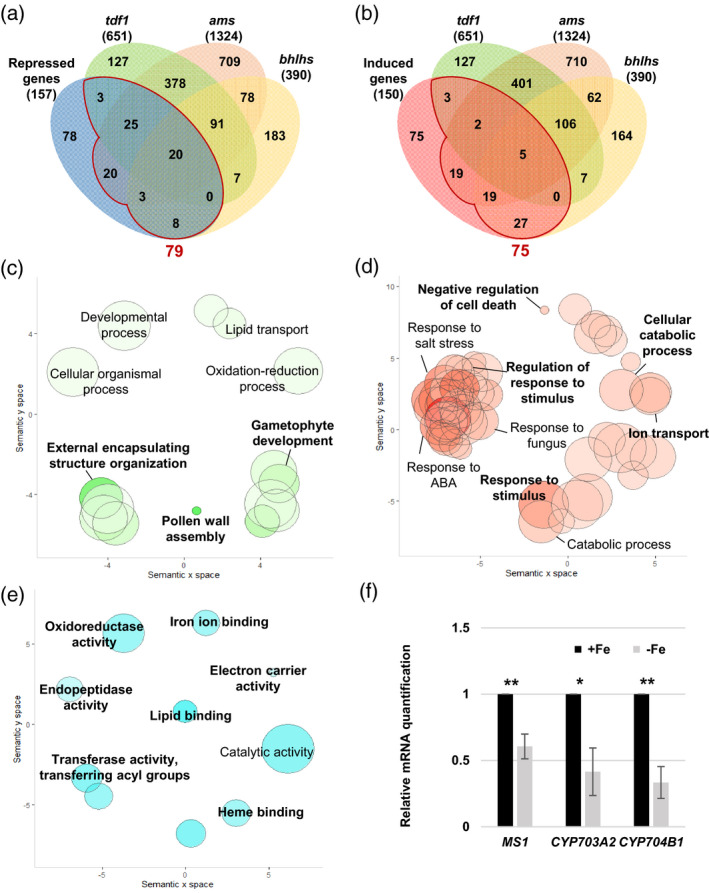
Figure 7.

Analysis of tapetum‐expressed DEGs in Fe‐deficient anthers and in tdf1, ams, and bhlhs mutants.
(a, b) Venn diagrams showing the overlap of 157 repressed (a) and 150 induced (b) tapetum‐expressed genes (P.adj < 0.05) in Fe‐deficient anthers and 651, 1324, and 390 tapetum‐expressed DEGs in the tdf1, ams, and bhlhs mutant transcriptomes, respectively. A total of 79 repressed and 75 induced DEGs, i.e., the sum of gene numbers from the regions in panels (a) and (b) enclosed by red lines, in Fe‐deficient anthers overlapped with DEGs in the tdf1, ams, and bhlhs mutants. (c–e) GO enrichment analysis of the −Fe DEGs detected in tdf1, ams, or bhlhs. Enriched GO terms in the biological process category for the 79 Fe deficiency‐repressed (c) and 75 Fe deficiency‐induced (d) genes indicated in panels (a) and (b), respectively. (e) Enriched GO terms in the molecular function category for the 79 Fe deficiency‐repressed genes detected in tdf1, ams, or bhlhs. Semantic representation of significantly enriched GO categories. Color intensity reflects the significance of the enrichment test, with dark colors corresponding to lower P‐values (<0.05). Circle size indicates the relative frequency of the GO term in the EBI GOA database (Barrell et al., 2009). (f) Comparison of mRNA levels between anthers of −Fe and +Fe plants as determined by qPCR. Data are shown as mean ± standard error of three independent experiments. *P < 0.05, **P < 0.01 between −Fe and +Fe anthers (Student’s t‐test).
