Figure 8.

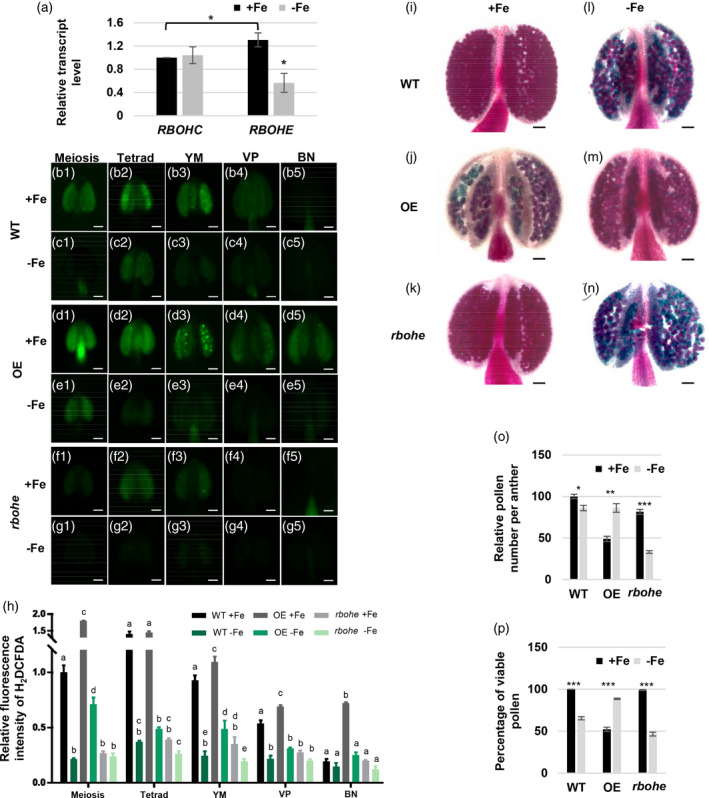
The expression level of RBOH in anthers and the effect of RBOHE level on pollen viability and anther ROS levels under Fe sufficiency and deficiency.
(a) The transcript levels of RBOHC and RBOHE in anthers grown under Fe‐sufficient (+Fe) and ‐deficient (−Fe) conditions were examined by qPCR. (b–g) ROS levels in different stage anthers of wild‐type (WT), Osg6b:RBOHE overexpression (OE), and rbohe mutant plants grown under +Fe and −Fe conditions were analyzed by H2DCFDA staining. (h) Quantification of H2DCFDA fluorescence intensity in anthers at different stages. Different letters represent statistically significant differences between +Fe and −Fe conditions and different lines in each stage according to two‐way anova with Tukey’s multiple comparisons test (P < 0.05) (Data S1). Pollen viability in anthers from WT, OE, and rbohe mutant plants grown under +Fe (i–k) and −Fe (l–n) conditions using Alexander staining. Viable pollen is purple and non‐viable pollen is blue‐green. (o) The quantification of relative pollen number per anther (versus WT under +Fe). (p) The quantification of the percentage of viable pollen. All of the pollen grains in anthers were counted. Data are shown as mean ± standard error of three independent experiments. *P < 0.05, **P < 0.01, ***P < 0.005 between −Fe and +Fe conditions (Student’s t‐test). Bars = 50 μm. YM, young microspore; VP, vacuolated pollen; BN, binucleate pollen.
