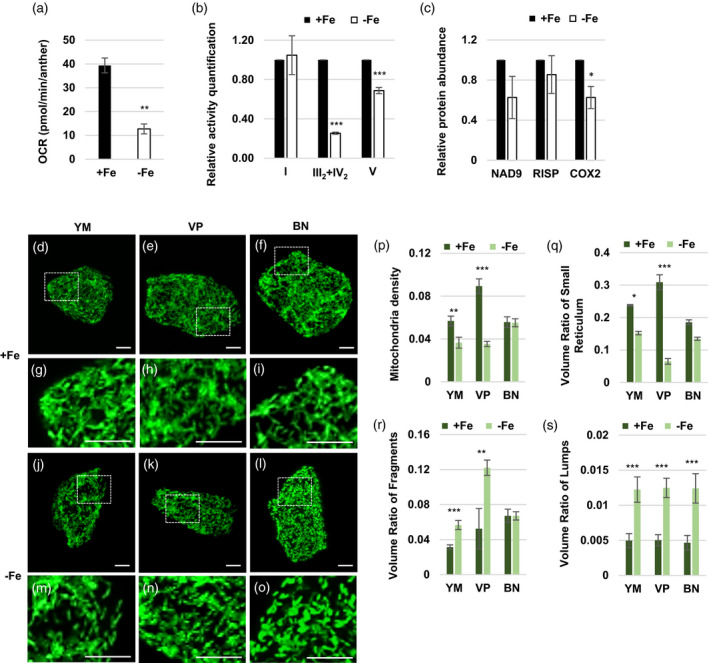
Figure 9.

Mitochondrial function and status in anthers and tapeta under Fe deficiency.
(a) The average basal oxygen consumption rates (OCRs) of six anthers (two from each stage) collected at the YM, VP, and BN stages from plants grown under Fe‐sufficient (+Fe) and ‐deficient (−Fe) conditions. (b) The relative mitochondrial complex activity. The same volumes of crude mitochondrial extract from anthers of Brassica napus were separated by BN‐PAGE. Then, the in‐gel activity of mitochondrial complexes I, IV, and V was quantified. (c) Relative protein abundances of NAD9, RISP, and COX2 were determined by Western blot analysis. (d–o) Mitochondrial morphology in the tapetum at the YM, VP, and BN stages. Individual tapetal cells expressing mito‐GFP from plants grown under +Fe (d–i) and −Fe (j–o) conditions were photographed under a Zeiss LSM780. Projected mitochondrial (GFP) images from Z‐stacks are shown. Bars = 5 μm. (p–s) The morphological features of tapetal cell mitochondria were analyzed by MicroP 3D automatic quantification software. Data are shown as mean ± standard error of three independent experiments. *P < 0.05, **P < 0.01, ***P < 0.005 between −Fe and +Fe conditions (Student’s t‐test). YM, young microspore; VP, vacuolated pollen; BN, binucleate pollen.
