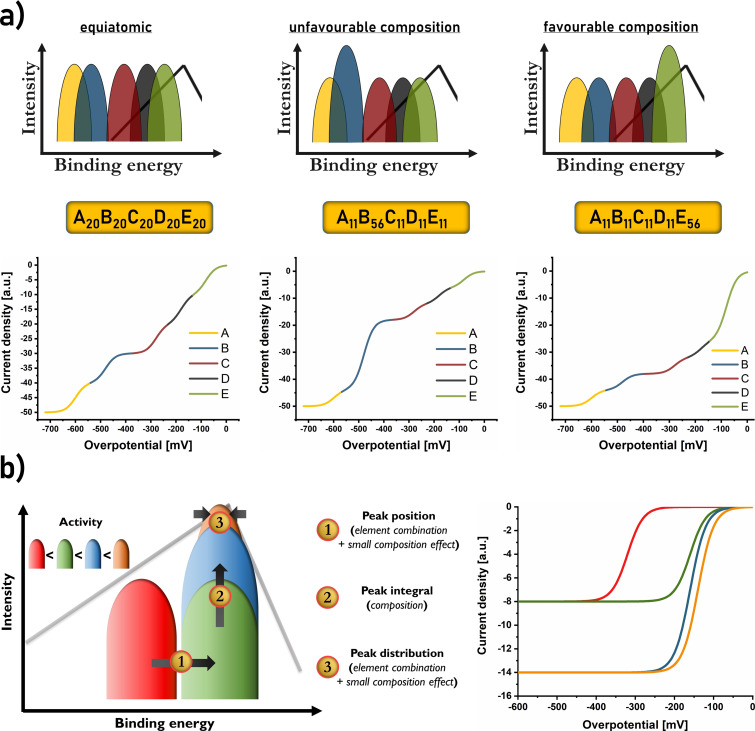
Figure 2.
a) Schematic illustration of how each CCSS binding peak of the BEDP yields one current wave in voltammetric measurements, where activity and plateau current depend on binding energy shift and peak integral, respectively. Hence, adjusting the composition affects the current wave proportions. In this representation, the absence of any mass‐transport effects allows visibility of all current waves. b) Since the most active current wave is of the highest interest, effects of element combination and composition on the binding peak are presented, and the effect on the corresponding current wave is shown.

