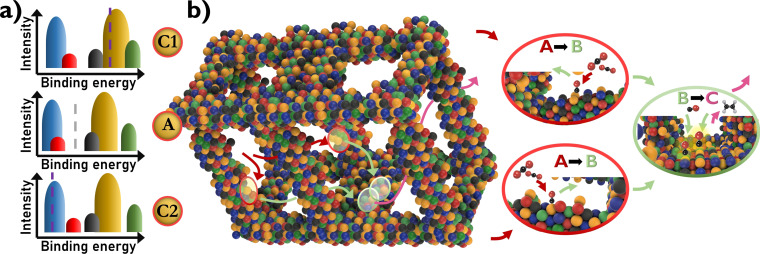
Figure 3.
a) Schematic BEDPs for C1: first cascade reaction step, A: alternative, undesired reaction, and C2: second cascade reaction step. The vertical lines represent the ideal binding energies for each reaction. The binding energy refers to the respective reactants, which can be different for each step. Thus, the peak pattern is altered. b) Combining the CCSS concept with a 3D architecture to trap formed intermediate products within the catalyst network and force their subsequent cascade reaction until the final product is obtained.

