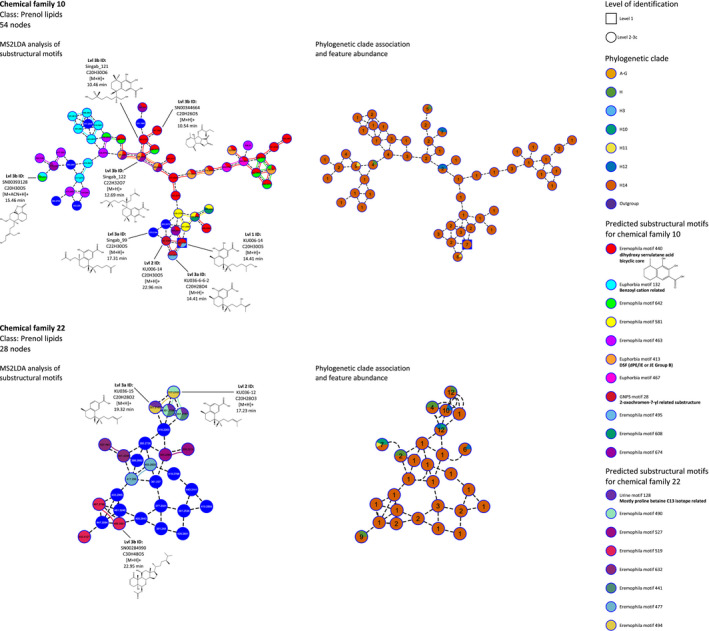
Figure 5.

In‐depth analysis of selected serrulatane diterpenoid‐related chemical families.
Detailed analysis of serrulatane diterpenoid‐related chemical families 10 and 22. On the left, chemical families are displayed with detected metabolite mass (Da) information for each node as well as individual dereplication events, which are highlighted with selected spectrometric and structural information. In addition, MS2LDA‐based substructure analysis is shown by color coded pie charts on each node, which point out areas of shared spectral motifs. On the right side, investigated chemical families harboring information about phylogenetic clade associations are shown, as displayed for every node with colored pie charts. Also the total amount of occurrences of each putative metabolite in the dataset is presented for every node.
