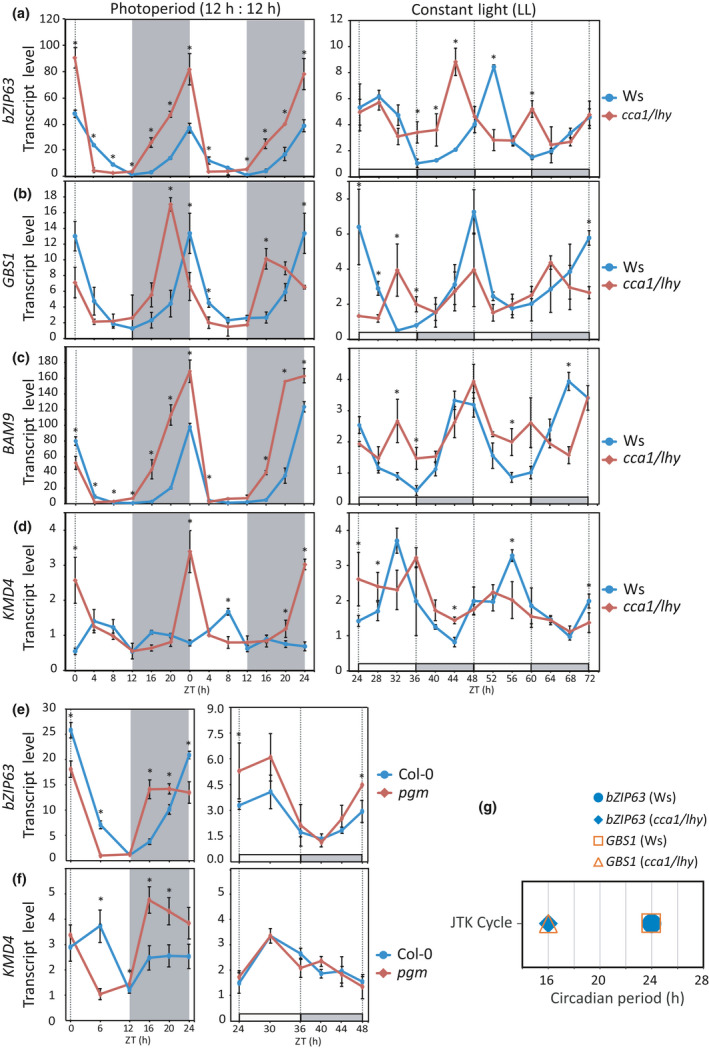
Fig. 3.

The circadian clock and carbon (C)/energy status control bZIP63 oscillatory pattern. (a) Circadian oscillation of bZIP63 transcript levels follows the shorter period of the double mutant cca1/lhy under free‐running conditions (LL), but does not show the expected phase advance under photoperiod (CCA1, CIRCADIAN CLOCK ASSOCIATED 1; LHY, Late Elongated Hypocotyl). (b) Transcripts levels of GBS1, which is a gene under circadian clock regulation, follows the shorter period of cca1/lhy in LL and shows a phase advance in photoperiod. (c) The bZIP63 direct target BAM9 presents transcript level oscillation following the shorter period of cca1/lhy in LL, but does not have the phase advance under photoperiod. (d) Under photoperiod, the C/energy starvation marker KMD4 is induced during the last part of the night in cca1/lhy. (e) bZIP63 transcript oscillation pattern is altered in the starch synthesis deficient mutant pgm under photoperiod, showing a rapid increase in the first hours of the night, which is consistent with the decrease of sugar concentrations at this time (Gibon et al., 2004). By contrast, transcript levels of bZIP63 were similar between pgm and Col‐0 in the early subjective night in LL. (f) The transcript level of the starvation marker KMD4 is increased at early night in pgm, whereas this is not observed in the early subjective night in LL. (g) Transcript levels of bZIP63 and GBS1 follow the shorter period of the double mutant cca1/lhy under LL. In the plotted graphs of photoperiod, white or gray backgrounds represents light or dark period, respectively. In graphs of LL, the x‐axis represents the time elapsed after releasing the plants into LL. The subjective day (ZT 24–36, 48–60) and subjective night (ZT 36–48, 60–72) are identified by white and gray bars on the x‐axis, respectively. The data were obtained from two independent experiments, with three biological replicates at each time point, and each replicate consisted of the whole rosette collected from three plants (two‐tailed Student’s t‐test; n = 9; *, P < 0.05). Values are means, and error bars indicate standard deviation.
